OPEN-SOURCE SCRIPT
3-Criteria Strategy
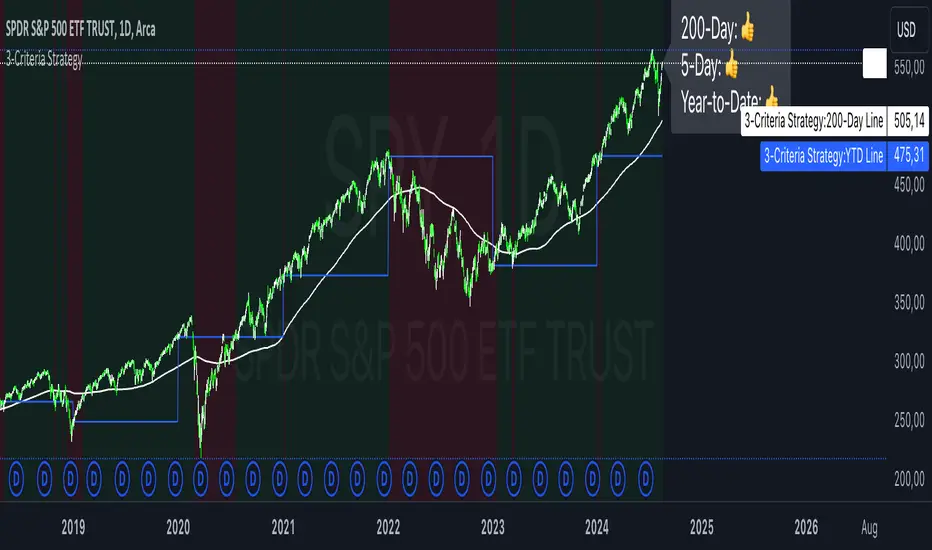
The "3-Criteria Strategy" is a simple yet effective trading strategy based on three criteria:
200-Day Moving Average: The first criterion checks whether the current price is above or below the 200-day moving average (SMA). A price above the 200-day line is considered bullish (thumbs up), while a price below is considered bearish (thumbs down).
5-Day Indicator: The second criterion evaluates the performance of the first five trading days of the year. If the closing price on the fifth trading day is higher than the closing price on the last trading day of the previous year, this is considered bullish (thumbs up). Otherwise, it's bearish (thumbs down).
Year-to-Date (YTD) Effect: The third criterion compares the current price with the closing price at the end of the previous year. A current price above the year-end price is bullish (thumbs up), while a price below is bearish (thumbs down).
Signal Interpretation:
Buy Signal: At least two of the three criteria must give a bullish signal (thumbs up).
Sell Signal: Zero or one bullish signal results in a bearish outlook.
The script provides visual cues with background colors:
Green background: Indicates a buy signal.
Red background: Indicates a sell signal.
Additionally, the script plots the 200-day moving average and the YTD line on the chart for better visualization.
Usage:
Apply the Script: Add the script to your TradingView chart.
Interpret Signals: Monitor the background color and the status label to determine trading actions.
Visual Aids: Use the 200-day line and YTD line plotted on the chart to confirm the criteria visually.
Scientific Research
The concepts used in this script—like the 200-day moving average and Year-to-Date effects—are well-documented in financial literature. However, the combination of these specific criteria as a trading strategy is more of a heuristic approach commonly used by traders rather than a subject of extensive academic research.
200-Day Moving Average: The 200-day moving average is widely regarded as a significant level in technical analysis, often serving as a demarcation between long-term bullish and bearish trends. Research has shown that long-term moving averages can be useful for trend-following strategies.
Reference: Brock, W., Lakonishok, J., & LeBaron, B. (1992). Simple Technical Trading Rules and the Stochastic Properties of Stock Returns. Journal of Finance, 47(5), 1731-1764.
Year-to-Date and Calendar Effects: The Year-to-Date effect and early-year performance (such as the January effect) have been studied extensively in the context of seasonal market anomalies.
Reference: Rozeff, M. S., & Kinney, W. R. (1976). Capital Market Seasonality: The Case of Stock Returns. Journal of Financial Economics, 3(4), 379-402.
While these papers don't address the exact combination of criteria used in your strategy, they provide a solid foundation for understanding the underlying concepts.
Скрипт с открытым кодом
В истинном духе TradingView, создатель этого скрипта сделал его открытым исходным кодом, чтобы трейдеры могли проверить и убедиться в его функциональности. Браво автору! Вы можете использовать его бесплатно, но помните, что перепубликация кода подчиняется нашим Правилам поведения.
Where others speculate, we systematize.
edgetools.org
edgetools.org
Отказ от ответственности
Информация и публикации не предназначены для предоставления и не являются финансовыми, инвестиционными, торговыми или другими видами советов или рекомендаций, предоставленных или одобренных TradingView. Подробнее читайте в Условиях использования.