OPEN-SOURCE SCRIPT
Interval — full-screen verticals + H/L + metrics (robust v6)
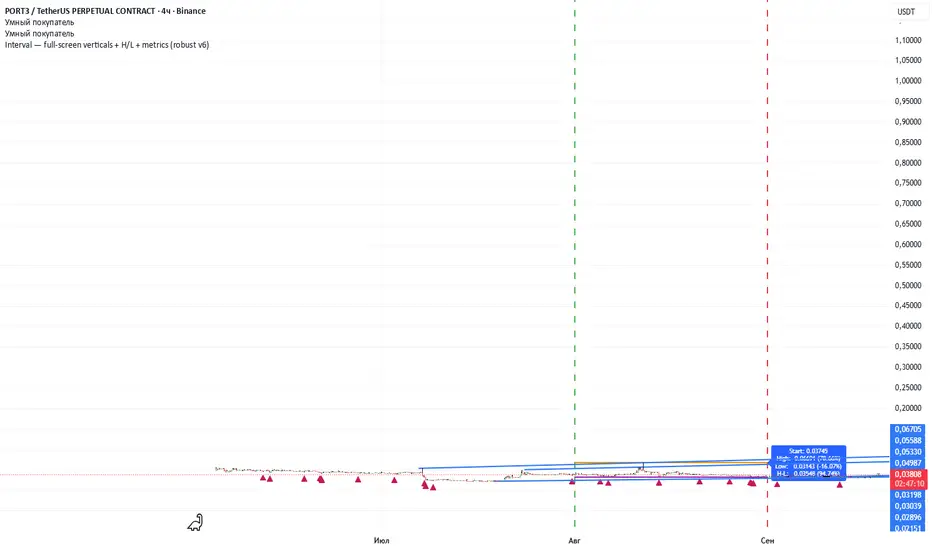
Specify the start date of the analysis and the end date of the analysis, after which 2 vertical lines will appear, the extremes in this period will be marked, and the percentage of deviations will be shown. Next, you can switch assets and see how they behave over the same time interval.
Скрипт с открытым кодом
В истинном духе TradingView, создатель этого скрипта сделал его открытым исходным кодом, чтобы трейдеры могли проверить и убедиться в его функциональности. Браво автору! Вы можете использовать его бесплатно, но помните, что перепубликация кода подчиняется нашим Правилам поведения.
Отказ от ответственности
Информация и публикации не предназначены для предоставления и не являются финансовыми, инвестиционными, торговыми или другими видами советов или рекомендаций, предоставленных или одобренных TradingView. Подробнее читайте в Условиях использования.