OPEN-SOURCE SCRIPT
Обновлено Compound Value @ annual rate
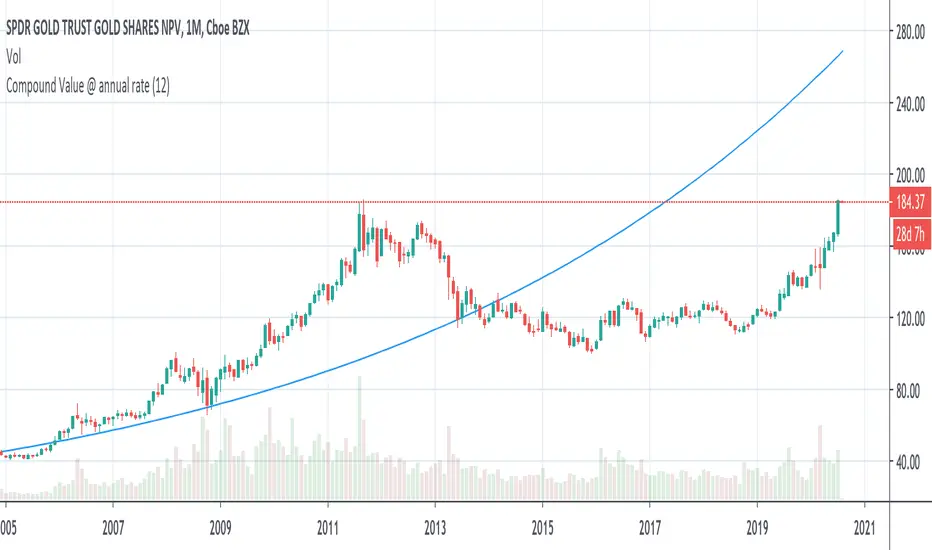
By studying historical data we can know the compounded growth rate of an investment from the inception date. For example if we know that an investment has grown at the rate of 6% in the past and if we expect similar growth in the future also, We can plot this graph to understand whether the current price is underpriced or overpriced as per projected return.
In this graph, it takes the initial close price as a principle and rate from the input and calculates the compound amount at each interval.
In this graph, it takes the initial close price as a principle and rate from the input and calculates the compound amount at each interval.
Информация о релизе
Author changeИнформация о релизе
Updated input data type for rateСкрипт с открытым кодом
В истинном духе TradingView, создатель этого скрипта сделал его открытым исходным кодом, чтобы трейдеры могли проверить и убедиться в его функциональности. Браво автору! Вы можете использовать его бесплатно, но помните, что перепубликация кода подчиняется нашим Правилам поведения.
Отказ от ответственности
Информация и публикации не предназначены для предоставления и не являются финансовыми, инвестиционными, торговыми или другими видами советов или рекомендаций, предоставленных или одобренных TradingView. Подробнее читайте в Условиях использования.
Скрипт с открытым кодом
В истинном духе TradingView, создатель этого скрипта сделал его открытым исходным кодом, чтобы трейдеры могли проверить и убедиться в его функциональности. Браво автору! Вы можете использовать его бесплатно, но помните, что перепубликация кода подчиняется нашим Правилам поведения.
Отказ от ответственности
Информация и публикации не предназначены для предоставления и не являются финансовыми, инвестиционными, торговыми или другими видами советов или рекомендаций, предоставленных или одобренных TradingView. Подробнее читайте в Условиях использования.