OPEN-SOURCE SCRIPT
Обновлено Volume Zone Oscillator by [VanHelsig]
Volume Zone Oscillator
How volume zone oscillator work:
Like other VZO it uses the same principle of calculation Volume direction divided on total volume and then scaled to 100 and -100.
When we have positive momentum close > close[loockback] we have value of positive Volume, other way we have -volume negative one. <- this called a volume direction
Total volume is simply moving average with source of volume
And then MA with source of volume direction divided on MA of total colume and scaled it from 100 to -100
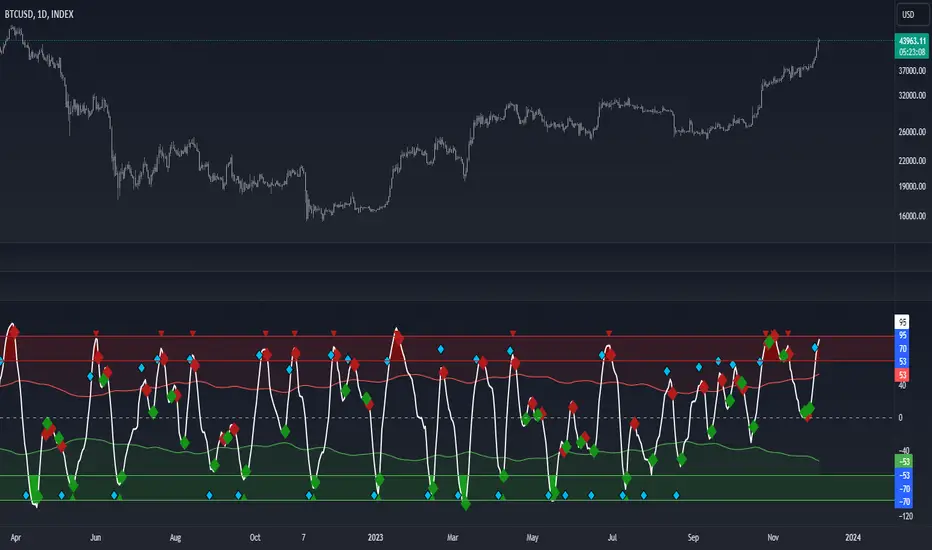
Basically we have few signals what VZO can show:
-Strong buy in oversold zone and strong sell in overbought zone. (Triangles at the top red and at the bottom green)
-Local Buy and Sell (Green and red Robustnesses)
-Posibility of trend change (Blue robustness)
Also you can webhook alerts to your spread sheet that sends values 1 for buys signals and -1 for sell signals in a range of 1 to 10 days
Here you can see marked signals on the chart

How volume zone oscillator work:
Like other VZO it uses the same principle of calculation Volume direction divided on total volume and then scaled to 100 and -100.
When we have positive momentum close > close[loockback] we have value of positive Volume, other way we have -volume negative one. <- this called a volume direction
Total volume is simply moving average with source of volume
And then MA with source of volume direction divided on MA of total colume and scaled it from 100 to -100
Basically we have few signals what VZO can show:
-Strong buy in oversold zone and strong sell in overbought zone. (Triangles at the top red and at the bottom green)
-Local Buy and Sell (Green and red Robustnesses)
-Posibility of trend change (Blue robustness)
Also you can webhook alerts to your spread sheet that sends values 1 for buys signals and -1 for sell signals in a range of 1 to 10 days
Here you can see marked signals on the chart
Информация о релизе
Updated calculations and backtested. Информация о релизе
-Информация о релизе
BackTest BTC Index (BackTest of local buys and local sells) BackTest ETH Index
https://www.tradingview.com/x/Dxb8cWuv/
Информация о релизе
Organazide code, changed default inputsСкрипт с открытым кодом
В истинном духе TradingView, создатель этого скрипта сделал его открытым исходным кодом, чтобы трейдеры могли проверить и убедиться в его функциональности. Браво автору! Вы можете использовать его бесплатно, но помните, что перепубликация кода подчиняется нашим Правилам поведения.
Отказ от ответственности
Информация и публикации не предназначены для предоставления и не являются финансовыми, инвестиционными, торговыми или другими видами советов или рекомендаций, предоставленных или одобренных TradingView. Подробнее читайте в Условиях использования.
Скрипт с открытым кодом
В истинном духе TradingView, создатель этого скрипта сделал его открытым исходным кодом, чтобы трейдеры могли проверить и убедиться в его функциональности. Браво автору! Вы можете использовать его бесплатно, но помните, что перепубликация кода подчиняется нашим Правилам поведения.
Отказ от ответственности
Информация и публикации не предназначены для предоставления и не являются финансовыми, инвестиционными, торговыми или другими видами советов или рекомендаций, предоставленных или одобренных TradingView. Подробнее читайте в Условиях использования.