debugger
This library provides an easy-to-use interface to print your debugging messages to a console in the chart. Special attention has been given to printing series and arrays easily.
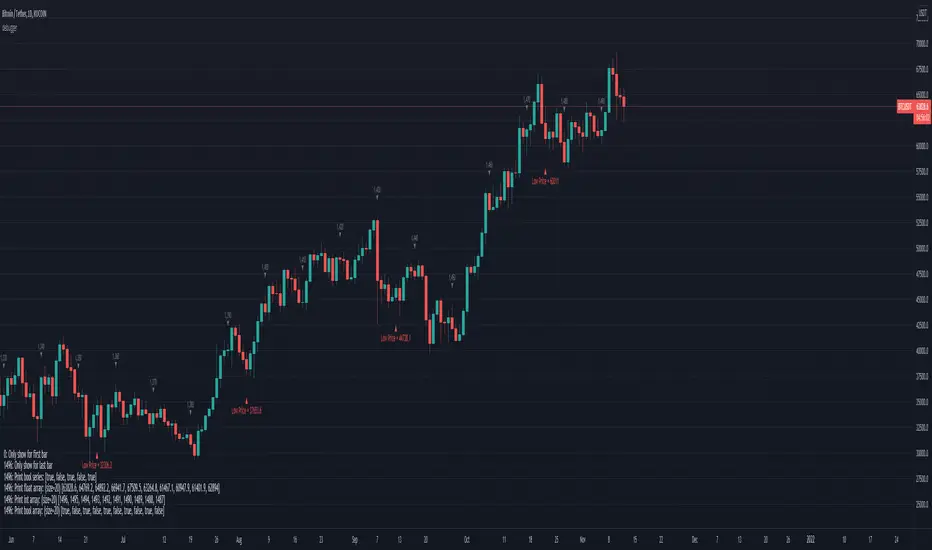
A debugger is a valuable tool when working on scripts and getting into trouble. Unfortunately, TradingView does not provide an interactive debugger, and does not provide a console to use the oldest trick in the debugging book: print statements. This library provides you with the latter tool, print statements.
As a bonus, the library also provides a way to show labels in the chart next to the pricing action.
For more information and examples of usage, check the description in the header comments.
Added show_bar_index() to plot the bar index on the chart. This is useful when debugging or refining your strategies over a specific date range, and you want to quickly find out the bar range in terms of bar_index.
Also added a simple style to show_label() to display the message without less background decoration.
And done a bit of tidy up and minor bug fixing.
Библиотека Pine
В истинном духе TradingView автор опубликовал этот код Pine как библиотеку с открытым исходным кодом, чтобы другие программисты Pine из нашего сообщества могли её использовать. Браво автору! Вы можете использовать эту библиотеку для личного пользования или в других публикациях с открытым исходным кодом, но повторное использование этого кода в публикациях регулируется Правилами поведения.
Отказ от ответственности
Библиотека Pine
В истинном духе TradingView автор опубликовал этот код Pine как библиотеку с открытым исходным кодом, чтобы другие программисты Pine из нашего сообщества могли её использовать. Браво автору! Вы можете использовать эту библиотеку для личного пользования или в других публикациях с открытым исходным кодом, но повторное использование этого кода в публикациях регулируется Правилами поведения.