OPEN-SOURCE SCRIPT
Обновлено FlipTracker
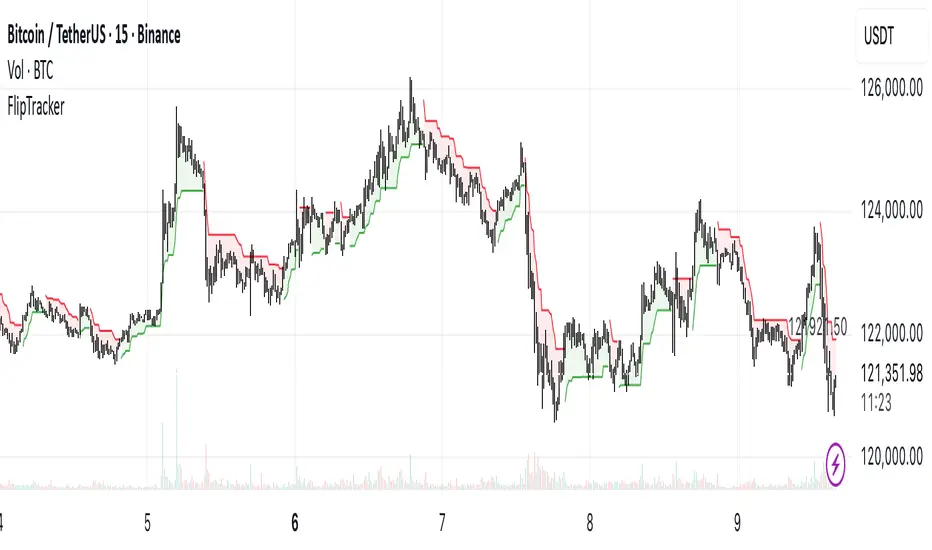
The FlipTracker is calculated using the Average True Range (ATR) to determine the indicator’s sensitivity to market volatility.
It plots a line above or below the price depending on whether the trend is bearish or bullish:
🟩 Bullish Trend – Price closes above the FlipTracker line.
🟥 Bearish Trend – Price closes below the FlipTracker line.
When the direction flips (price crossing the FlipTracker), the indicator changes color and provides a potential trend reversal signal.
Информация о релизе
FlipTrackerСкрипт с открытым кодом
В истинном духе TradingView автор этого скрипта опубликовал его с открытым исходным кодом, чтобы трейдеры могли понять, как он работает, и проверить на практике. Вы можете воспользоваться им бесплатно, но повторное использование этого кода в публикации регулируется Правилами поведения.
Отказ от ответственности
Все виды контента, которые вы можете увидеть на TradingView, не являются финансовыми, инвестиционными, торговыми или любыми другими рекомендациями. Мы не предоставляем советы по покупке и продаже активов. Подробнее — в Условиях использования TradingView.
Скрипт с открытым кодом
В истинном духе TradingView автор этого скрипта опубликовал его с открытым исходным кодом, чтобы трейдеры могли понять, как он работает, и проверить на практике. Вы можете воспользоваться им бесплатно, но повторное использование этого кода в публикации регулируется Правилами поведения.
Отказ от ответственности
Все виды контента, которые вы можете увидеть на TradingView, не являются финансовыми, инвестиционными, торговыми или любыми другими рекомендациями. Мы не предоставляем советы по покупке и продаже активов. Подробнее — в Условиях использования TradingView.