Projected EMA based on past 21 days [UOI]
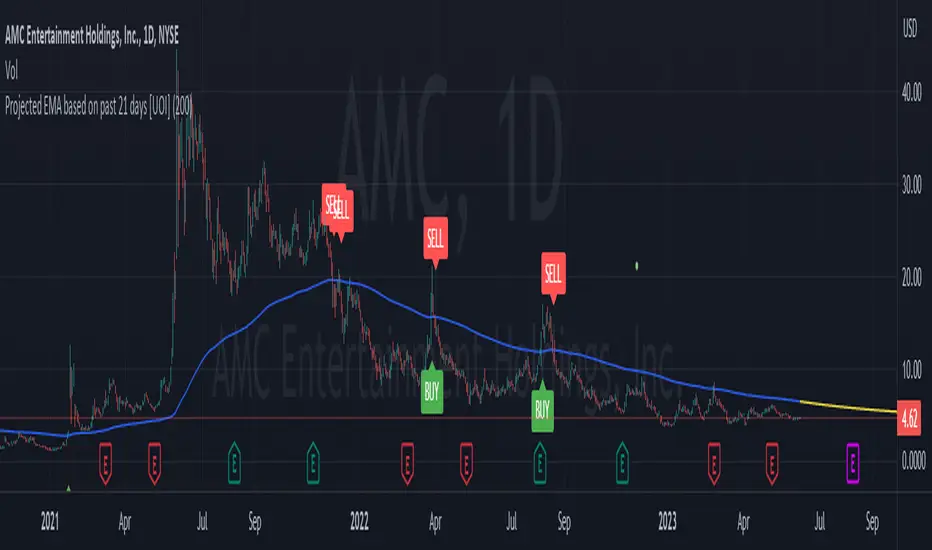
Here is a good example with
This indicator is designed to help you predict the future crossover point by calculating the average price over the past 21 days and projecting the 200-day EMA for the future.
This indicator is tailored to assist average individuals who are interested in swing trading stocks or other securities. It enables them to anticipate when the price of a stock might move above or below a significant level known as the 200-day EMA, although it can be adjusted to different values like 100 or 50 EMA. When a stock price moves above the 200-day EMA, it is often considered a positive sign for future price increases.
Here is how this can help us understand the natural cycle of price action:
The indicator functions by calculating the average price over the past 200 days, which helps smooth out daily price fluctuations and provides a clearer perspective of the overall trend. It also considers the average price change over the previous 21 days to project future prices. By doing so, it aims to predict when the price might cross above the 200-day EMA line.
When utilizing this indicator, you will observe two lines on the price chart. The first line represents the 200-day EMA, visually depicting the average price trend. The second set of lines, displayed as dashed lines, indicate potential future price movements. These lines assist in anticipating when the price might surpass the 200-day EMA line, indicating a potential upcoming bullish (upward) trend.
To summarize, this indicator serves as a valuable tool for average individuals interested in trading securities. It facilitates the identification of critical points in stock prices, empowering users to make more informed decisions regarding when to buy or sell based on projected movements relative to the 200-day EMA line.
Скрипт с ограниченным доступом
Доступ к этому скрипту имеют только пользователи, одобренные автором. Вам необходимо запросить и получить разрешение на его использование. Обычно оно предоставляется после оплаты. Для получения подробной информации следуйте инструкциям автора ниже или свяжитесь напрямую с uoi2020.
TradingView НЕ рекомендует оплачивать или использовать скрипт, если вы полностью не доверяете его автору и не понимаете, как он работает. Вы также можете найти бесплатные, открытые альтернативы в наших скриптах сообщества.
Инструкции от автора
Отказ от ответственности
Скрипт с ограниченным доступом
Доступ к этому скрипту имеют только пользователи, одобренные автором. Вам необходимо запросить и получить разрешение на его использование. Обычно оно предоставляется после оплаты. Для получения подробной информации следуйте инструкциям автора ниже или свяжитесь напрямую с uoi2020.
TradingView НЕ рекомендует оплачивать или использовать скрипт, если вы полностью не доверяете его автору и не понимаете, как он работает. Вы также можете найти бесплатные, открытые альтернативы в наших скриптах сообщества.