PROTECTED SOURCE SCRIPT
Обновлено NeuroZg
This indicator visually displays Gamma Push (support) and Gamma Resistance zones using colored rectangles.
It helps traders identify areas where market makers may apply directional pressure or absorb volatility based on options exposure.
Settings:
- ZE1–ZE3: Gamma Push (support)
- ZR1–ZR3: Gamma Resistance
- Zone thickness: ±2
- Extension: 50 bars (default)
- Customizable colors
Note:
This script does not calculate gamma automatically.
Users must enter their own levels (e.g., from SpotGamma, UnusualWhales, or personal data).
Информация о релизе
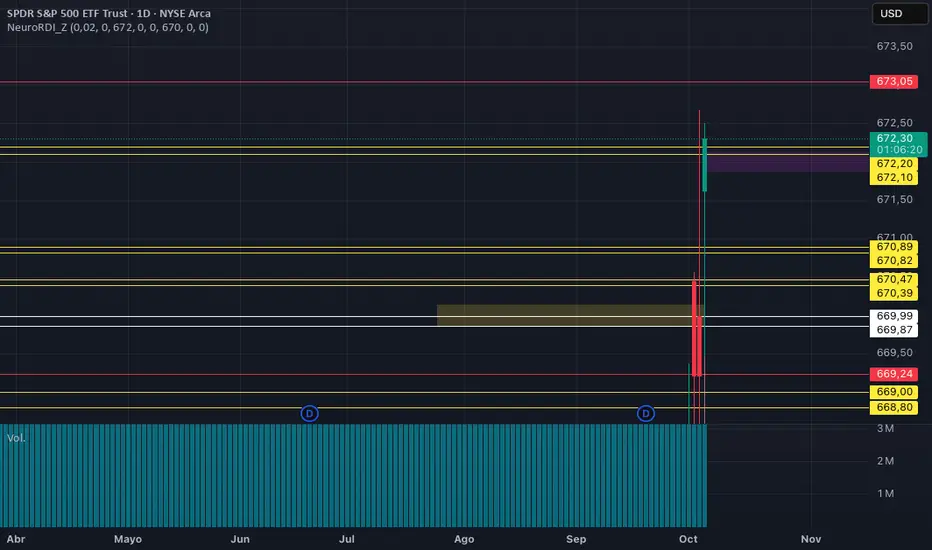
Overviewneurordi_z visualizes Gamma Push (support) and Gamma Resistance zones derived from options-market positioning. The script plots colored rectangles at user-defined price levels to highlight areas where market maker hedging can create directional pressure, absorption, or potential reversals.
What it draws
Gamma Flip (GF) — A horizontal purple line at the user’s flip level.
Gamma Push (ZE) — Purple zones extending to the right of the current bar. Intended as positive-gamma support/absorption areas.
Gamma Resistance (ZR) — Yellow zones extending to the left of the current bar. Intended as negative-gamma resistance/supply areas.
Inputs
ZE1, ZE2, ZE3: up to three Gamma Push levels (center price per zone).
ZR1, ZR2, ZR3: up to three Gamma Resistance levels (center price per zone).
Gamma Flip (level): the expected sign-change (gamma flip) level.
Zone thickness (percent): default 0.02% of price (applied symmetrically above/below each level; internally clamped to a minimum based on syminfo.mintick).
Colors / border: ZE (purple), ZR (yellow); optional border styling.
Design details
Zones are drawn as price rectangles anchored at each level; ZE projects forward (right), ZR backward (left).
By design, each rectangle extends 50 bars on its side (observing TradingView’s ±500 bar drawing limit).
The thickness is percentage-based by default so zones scale appropriately across low- and high-priced instruments.
Recommended workflow
Prior to the session (e.g., pre-market), determine ZE/ZR and the Gamma Flip from your preferred data source or methodology.
Enter ZE1–ZE3 / ZR1–ZR3 and the flip level in the settings.
Use the zones as a structural map for liquidity, absorption, and potential reaction areas through the session.
Works well on indices and ETFs such as SPX, SPY, QQQ, but can be applied to any symbol.
Notes & limitations
neurordi_z does not fetch or compute gamma data automatically; levels are user-supplied.
This tool is for market structure visualization only and is not investment advice.
Short summary (≤200 chars)
Visualizes user-defined Gamma Push (support) and Gamma Resistance zones, plus a Gamma Flip line. Percent-based thickness (0.02% default). Designed for SPX/SPY/QQQ and any symbol.
Скрипт с защищённым кодом
Этот скрипт опубликован с закрытым исходным кодом. Однако вы можете использовать его свободно и без каких-либо ограничений — читайте подробнее здесь.
Отказ от ответственности
Все виды контента, которые вы можете увидеть на TradingView, не являются финансовыми, инвестиционными, торговыми или любыми другими рекомендациями. Мы не предоставляем советы по покупке и продаже активов. Подробнее — в Условиях использования TradingView.