[KICK] Ultimate ADXDMI
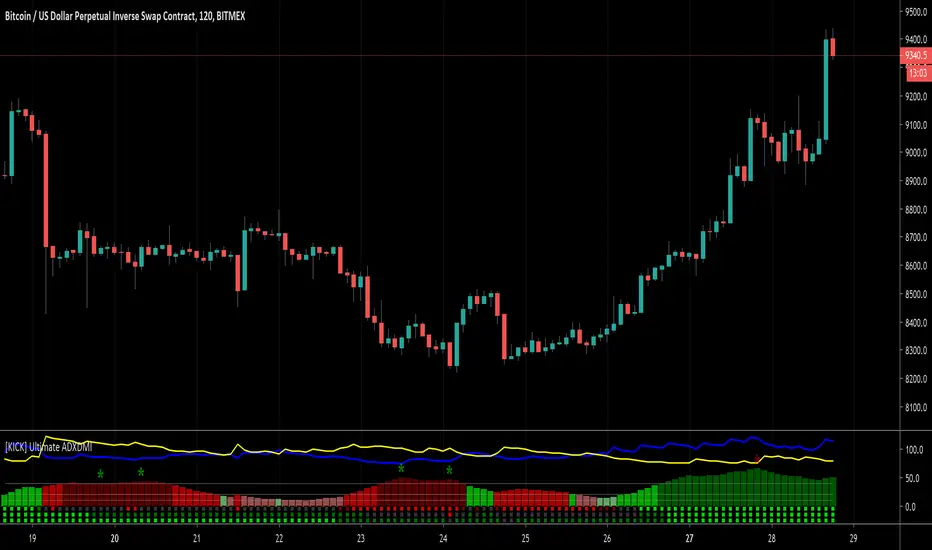
Use the ADX barchart to determine strength of trend. There are various configurable thresholds for this measurement as well as peak marking within the exhaustion zone. The higher the values in the bar chart, the stronger the trend. Low values indicate non-trending or choppy price action.
Use the DMI line graphs (as well as the color codes on the ADX barchart) to determine trending direction. You can offset the DI+ and DI- lines so that they are not directly on top of the ADX chart. When the DI+ is on top (blue line by default) the trend is up and when the DI- line (yellow by default) is on top the trend is down. The colors of the ADX chart also indicate direction with red indicating down and green indicating up. The "pale" shades indicate a nacent/immature trend, "bright" shades indicate a solid trend, and the "darker" shades indicate a strong trend that is mature. Look for these mature trends to "top out" and have their peaks marked when the trend has exhausted itself (note that the peak indicators will repaint 1-2 candles in the past after the "high" is confirmed).
You can specify up to 3 additional timeframes to monitor in the dot map below the ADX chart that will give you a generalized idea of the trend on those larger timeframes. In these heat maps, the color red indicates a down trend and green an up trend. The brighter colors denote strong trends while the darker colors are weaker. Grey dots in the heat map indicate no strong trend present. Some users actually prefer to turn off the main ADX and DMI visualizations and only display the multi-timeframe heatmap as a way of checking higher timeframe trends before entering their trades.
Use the link below to watch a tutorial video, request a trial, or purchase for access.
Скрипт с ограниченным доступом
Доступ к этому скрипту имеют только пользователи, одобренные автором. Вам необходимо запросить и получить разрешение на его использование. Обычно оно предоставляется после оплаты. Для получения подробной информации следуйте инструкциям автора ниже или свяжитесь напрямую с CryptoKick.
TradingView НЕ рекомендует оплачивать или использовать скрипт, если вы полностью не доверяете его автору и не понимаете, как он работает. Вы также можете найти бесплатные, открытые альтернативы в наших скриптах сообщества.
Инструкции от автора
kickstudios.com/tools
PineScript Indicator Development course
kickstudios.com/courses
Trading Discord Community (Apex Trades)
discord.gg/K5hFQKHaKr
Отказ от ответственности
Скрипт с ограниченным доступом
Доступ к этому скрипту имеют только пользователи, одобренные автором. Вам необходимо запросить и получить разрешение на его использование. Обычно оно предоставляется после оплаты. Для получения подробной информации следуйте инструкциям автора ниже или свяжитесь напрямую с CryptoKick.
TradingView НЕ рекомендует оплачивать или использовать скрипт, если вы полностью не доверяете его автору и не понимаете, как он работает. Вы также можете найти бесплатные, открытые альтернативы в наших скриптах сообщества.
Инструкции от автора
kickstudios.com/tools
PineScript Indicator Development course
kickstudios.com/courses
Trading Discord Community (Apex Trades)
discord.gg/K5hFQKHaKr