OPEN-SOURCE SCRIPT
Candle Strength Analysis

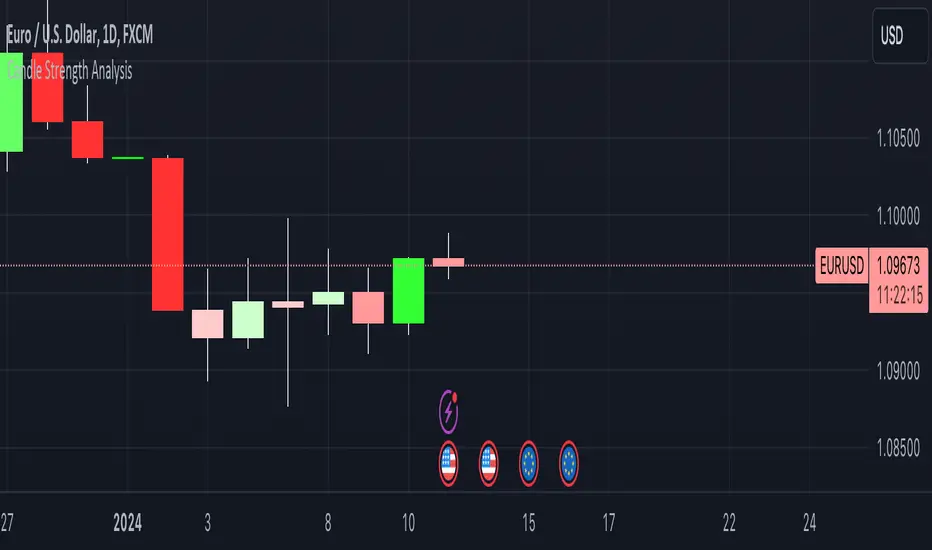
View candles differently with this new indicator designed to simply visualise and analyse price movements on your chart!
The more vibrant the colour, the stronger the conviction of its respective candle.
This simple script calculates the closing price as a percentage within the candles high/low range. A colour/strength rating is then assigned to the candle based on where this close price sits within the range.
Strong coloured candles occur when the close is very close to a high or low.
User defined percentage and colour inputs allow for quick personalisation and flexibility.
An additional wick imbalance feature identifies when a candle has a larger wick than its body, which may be used to identify a ranging market or shift in trader sentiment.
For any questions, concerns, or requests, please reach out to me in the comments below.
- The Pine Guru
Скрипт с открытым кодом
В истинном духе TradingView, создатель этого скрипта сделал его открытым исходным кодом, чтобы трейдеры могли проверить и убедиться в его функциональности. Браво автору! Вы можете использовать его бесплатно, но помните, что перепубликация кода подчиняется нашим Правилам поведения.
Отказ от ответственности
Информация и публикации не предназначены для предоставления и не являются финансовыми, инвестиционными, торговыми или другими видами советов или рекомендаций, предоставленных или одобренных TradingView. Подробнее читайте в Условиях использования.