OPEN-SOURCE SCRIPT
Обновлено MULTI TF SCANNER
Multi-Timeframe Moving Average Scanner Script
This script is designed to scan multiple timeframes for specific moving average (MA) crossovers to help traders identify potential buy or sell signals. The moving averages, such as the Simple Moving Average (SMA) or Exponential Moving Average (EMA), are calculated for different timeframes, allowing the script to provide a comprehensive analysis of the market trend.
Features:
Multiple Timeframe Analysis:
The script scans across various timeframes, including 5 minutes, 15 minutes, 1 hour, 4 hours, 1 day, and 1 week.
The moving averages are calculated for each of these timeframes, enabling the trader to gauge trends across short, medium, and long-term periods.
MA Crossover Detection:
The script checks for crossovers between a fast-moving average (e.g., 9-period) and a slow-moving average (e.g., 50-period).
A bullish crossover (fast MA crossing above slow MA) signals a potential buy, while a bearish crossover (fast MA crossing below slow MA) signals a potential sell.
Recursive Timeframe Check:
Before generating a buy or sell signal, the script checks for confirmations from higher timeframes.
Signals are only generated when the crossovers align across multiple timeframes (e.g., a buy signal on the 5-minute chart is confirmed by a bullish crossover on the 1-hour and 4-hour charts).
Signal Quality Indicator:
The script assigns a quality score to each signal based on how many higher timeframes confirm the crossover.
A stronger confirmation across multiple timeframes increases the quality of the signal, which can be visualized on the chart.
Optimized for Performance:
The calculations for moving average crossovers are designed to minimize unnecessary recalculations, optimizing the script’s performance and reducing lag.
The multi-timeframe checks are done only when the moving average crossover occurs or changes, ensuring efficiency.
User-Friendly Interface:
The results are displayed on the chart with clear visual cues to indicate the buy/sell signals and signal strength.
The script is minimalistic, with an uncluttered interface, providing the user with only the most relevant information for making trading decisions.
Информация о релизе
Update some optimization to existimg scriptИнформация о релизе
Upgrade to version 3 by adding atr stoplossИнформация о релизе
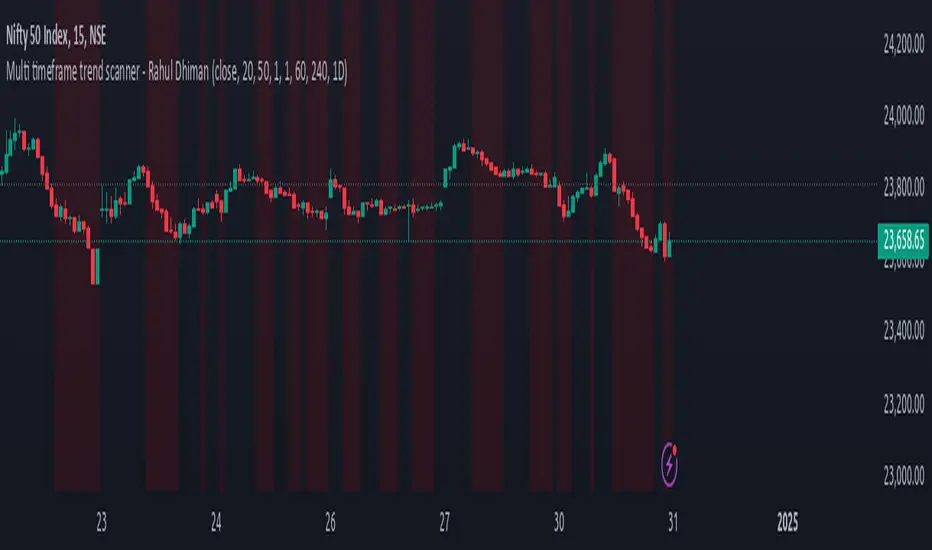
Multi Timeframe Trend Scanner by Rahul DhimanUpdate new version
Скрипт с открытым кодом
В истинном духе TradingView, создатель этого скрипта сделал его открытым исходным кодом, чтобы трейдеры могли проверить и убедиться в его функциональности. Браво автору! Вы можете использовать его бесплатно, но помните, что перепубликация кода подчиняется нашим Правилам поведения.
Отказ от ответственности
Информация и публикации не предназначены для предоставления и не являются финансовыми, инвестиционными, торговыми или другими видами советов или рекомендаций, предоставленных или одобренных TradingView. Подробнее читайте в Условиях использования.