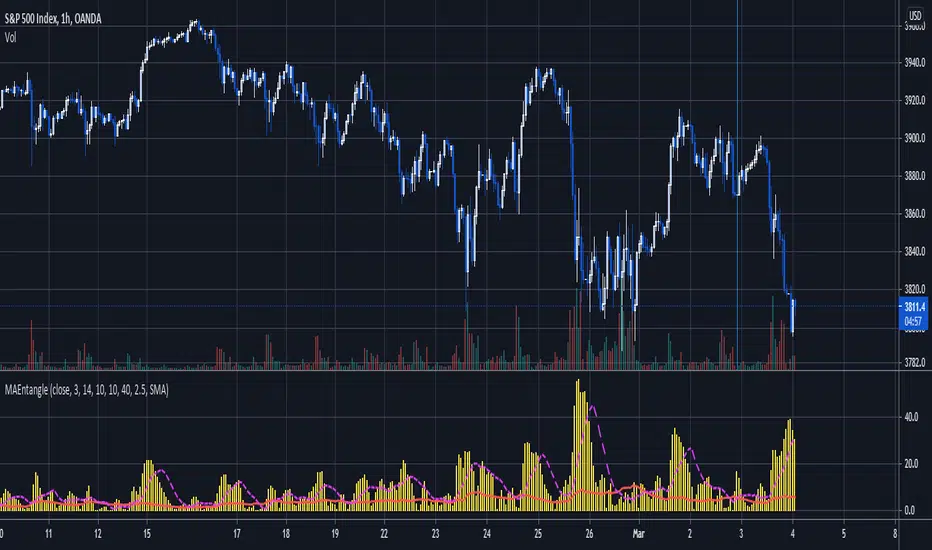
This script uses the gap in moving averages standardized to the average true range to determine entry and exit points.
The red line represents the current percentage of ATR that is deemed "The Dead Zone" - a move that is too small to be reliable.
The histogram represents the gap between moving averages. When the histogram is above the red line, it confirms a breakout move.
The dashed line an be used as a secondary filter and is a moving average of the histogram.
When Standard Deviation mode is on, a third line is displayed, which represents how many standard Deviations the current histogram bar represents, and can be also used as a filter.
Информация о релизе
added option to color histogram based on bullish/bearish Gap of MAsИнформация о релизе
Added AlertsИнформация о релизе
bug fix for alert conditions to only fire on crossoversИнформация о релизе
Added alerts when the histogram changes color (goes bullish from bearish or vice-versa) after two or more previous bars of the opposite colorИнформация о релизе
added price source as an input parameterИнформация о релизе
Added alert conditions for Std Deviation/MA crossovers and crossundersСкрипт с открытым кодом
В истинном духе TradingView, создатель этого скрипта сделал его открытым исходным кодом, чтобы трейдеры могли проверить и убедиться в его функциональности. Браво автору! Вы можете использовать его бесплатно, но помните, что перепубликация кода подчиняется нашим Правилам поведения.
Software Engineer and FX, Options, Crypto Trader. Previously worked at large options market maker. If you like my scripts and would like to donate:
Bitcoin: 179ETrGo3FCVcnBV8i1uc4J8YHFRknYytz
Eth: 0x73d59A8214FD70053aF37E9700692e25de441245
Bitcoin: 179ETrGo3FCVcnBV8i1uc4J8YHFRknYytz
Eth: 0x73d59A8214FD70053aF37E9700692e25de441245
Отказ от ответственности
Информация и публикации не предназначены для предоставления и не являются финансовыми, инвестиционными, торговыми или другими видами советов или рекомендаций, предоставленных или одобренных TradingView. Подробнее читайте в Условиях использования.
Скрипт с открытым кодом
В истинном духе TradingView, создатель этого скрипта сделал его открытым исходным кодом, чтобы трейдеры могли проверить и убедиться в его функциональности. Браво автору! Вы можете использовать его бесплатно, но помните, что перепубликация кода подчиняется нашим Правилам поведения.
Software Engineer and FX, Options, Crypto Trader. Previously worked at large options market maker. If you like my scripts and would like to donate:
Bitcoin: 179ETrGo3FCVcnBV8i1uc4J8YHFRknYytz
Eth: 0x73d59A8214FD70053aF37E9700692e25de441245
Bitcoin: 179ETrGo3FCVcnBV8i1uc4J8YHFRknYytz
Eth: 0x73d59A8214FD70053aF37E9700692e25de441245
Отказ от ответственности
Информация и публикации не предназначены для предоставления и не являются финансовыми, инвестиционными, торговыми или другими видами советов или рекомендаций, предоставленных или одобренных TradingView. Подробнее читайте в Условиях использования.