OPEN-SOURCE SCRIPT
Обновлено SMADIF4 Indicator
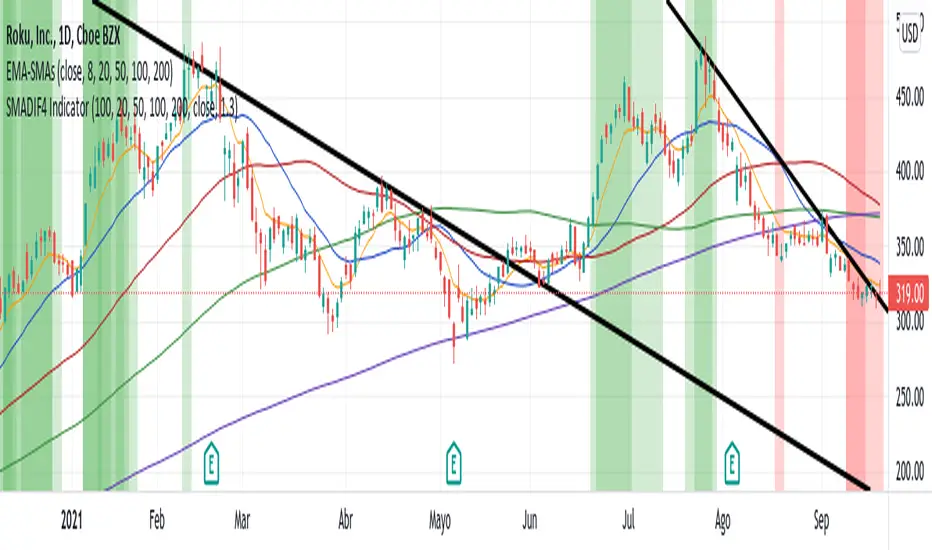
It shows a percentage difference between close and 4-SMA, 20, 50, 100 and 200. As it turns greener, the stock is more expensive, and vice versa, it turns redder when it becomes cheaper relative to the SMA. It will print the green backgraound as long as the bar closes above the 200 SMA and red as long as the bar closes below the 200 SMA. It uses by default 1.3 sigma to discriminate non-representative values and 100 bars in the past.
Информация о релизе
Algunas definiciones en el codigoИнформация о релизе
Description in color screen configurationСкрипт с открытым кодом
В истинном духе TradingView, создатель этого скрипта сделал его открытым исходным кодом, чтобы трейдеры могли проверить и убедиться в его функциональности. Браво автору! Вы можете использовать его бесплатно, но помните, что перепубликация кода подчиняется нашим Правилам поведения.
Отказ от ответственности
Информация и публикации не предназначены для предоставления и не являются финансовыми, инвестиционными, торговыми или другими видами советов или рекомендаций, предоставленных или одобренных TradingView. Подробнее читайте в Условиях использования.
Скрипт с открытым кодом
В истинном духе TradingView, создатель этого скрипта сделал его открытым исходным кодом, чтобы трейдеры могли проверить и убедиться в его функциональности. Браво автору! Вы можете использовать его бесплатно, но помните, что перепубликация кода подчиняется нашим Правилам поведения.
Отказ от ответственности
Информация и публикации не предназначены для предоставления и не являются финансовыми, инвестиционными, торговыми или другими видами советов или рекомендаций, предоставленных или одобренных TradingView. Подробнее читайте в Условиях использования.