OPEN-SOURCE SCRIPT
Обновлено Foxy's Z-Score

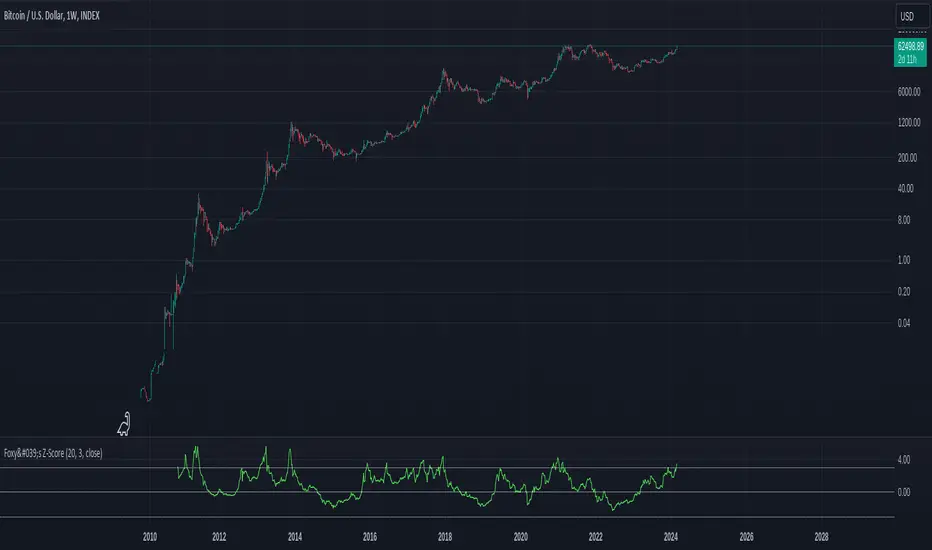
Introducing Foxy's Z-Score Indicator, a powerful tool for identifying potential trend reversals and market anomalies. This indicator calculates the Z-Score of the closing price, which represents the number of standard deviations from the mean, providing valuable insights into the market's behavior.
Key Features:
Auto Length Selection: The script automatically selects the optimal length based on the selected timeframe, ensuring accurate calculations and relevant signals.
Customizable Length and Standard Deviations: Users can manually input their preferred length and standard deviation values, offering flexibility to adapt to various trading strategies and market conditions.
Visual Representation: The indicator plots the Z-Score line along with three horizontal lines representing the standard deviation values, making it easy to identify overbought and oversold conditions.
Multiple Timeframes: The indicator works seamlessly across different timeframes, allowing traders to analyze short-term and long-term trends.
By incorporating Foxy's Z-Score Indicator into your trading toolkit, you can enhance your ability to spot potential market reversals and make more informed trading decisions.
Информация о релизе
Add Option to Smooth SourceИнформация о релизе
Add Multiple MA and Fix Default ParametersИнформация о релизе
Add DSMAСкрипт с открытым кодом
In true TradingView spirit, the creator of this script has made it open-source, so that traders can review and verify its functionality. Kudos to the author! While you can use it for free, remember that republishing the code is subject to our House Rules.
Отказ от ответственности
The information and publications are not meant to be, and do not constitute, financial, investment, trading, or other types of advice or recommendations supplied or endorsed by TradingView. Read more in the Terms of Use.
Скрипт с открытым кодом
In true TradingView spirit, the creator of this script has made it open-source, so that traders can review and verify its functionality. Kudos to the author! While you can use it for free, remember that republishing the code is subject to our House Rules.
Отказ от ответственности
The information and publications are not meant to be, and do not constitute, financial, investment, trading, or other types of advice or recommendations supplied or endorsed by TradingView. Read more in the Terms of Use.