OPEN-SOURCE SCRIPT
Обновлено Trend Master
Notes:
Tradingview has strict house rules of not allowing Heikin Ashi charts (and others beside normal price chart) to be used together with the indicator for trend analysis.
However, there may be users already using previous version of Trend Master but unfortunately has been hidden by Tradingview.
In view of this I decided to re-post the updated version, with the use of normal price chart only. Hope this help.
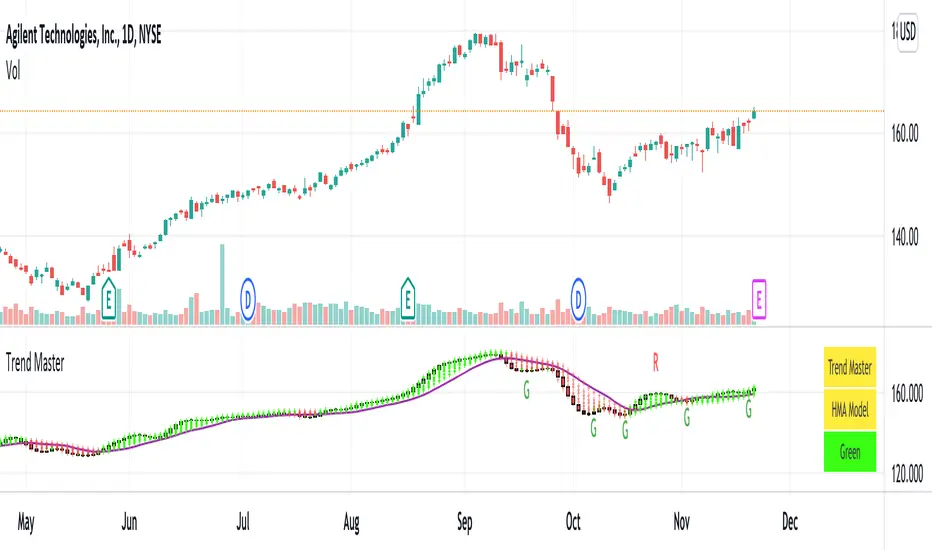
1. Trend Master, an indicator for trend analysis with the use of normal price chart.
2. Trend Master candle is in the form of solid candle without upper and lower tails.
The candle is in green color during an uptrend and red color during a downtrend.
When candle changes from red color to green color, it may signify the potential change from a down trend to an uptrend, vice versa.
3. Users can select the trend analysis model as they see fit, namely EMA , SMA , WMA and HMA .
4. Moving average lines of Trend Master are also included. Default is SMA13, the rest are SMA5, SMA21.
5. Users can turn on Rainbows if needed, it may help to detect the small changes of trend, if any.
6. A table of Indicator Name, Trend Model and Trend status is included. User can turn on to see the details.
Comments are welcome to further improve the accuracy of indicator that will benefit public users. Hope this help.
Disclaimer : attached chart is for the purpose of illustrating the indicator, no recommendation on buy/sell
Tradingview has strict house rules of not allowing Heikin Ashi charts (and others beside normal price chart) to be used together with the indicator for trend analysis.
However, there may be users already using previous version of Trend Master but unfortunately has been hidden by Tradingview.
In view of this I decided to re-post the updated version, with the use of normal price chart only. Hope this help.
1. Trend Master, an indicator for trend analysis with the use of normal price chart.
2. Trend Master candle is in the form of solid candle without upper and lower tails.
The candle is in green color during an uptrend and red color during a downtrend.
When candle changes from red color to green color, it may signify the potential change from a down trend to an uptrend, vice versa.
3. Users can select the trend analysis model as they see fit, namely EMA , SMA , WMA and HMA .
4. Moving average lines of Trend Master are also included. Default is SMA13, the rest are SMA5, SMA21.
5. Users can turn on Rainbows if needed, it may help to detect the small changes of trend, if any.
6. A table of Indicator Name, Trend Model and Trend status is included. User can turn on to see the details.
Comments are welcome to further improve the accuracy of indicator that will benefit public users. Hope this help.
Disclaimer : attached chart is for the purpose of illustrating the indicator, no recommendation on buy/sell
Информация о релизе
revision 2, 22Nov21, convert to scripts version 5. Table size adjustable. Allow input on Trend Moving Average Length. Скрипт с открытым кодом
В истинном духе TradingView, создатель этого скрипта сделал его открытым исходным кодом, чтобы трейдеры могли проверить и убедиться в его функциональности. Браво автору! Вы можете использовать его бесплатно, но помните, что перепубликация кода подчиняется нашим Правилам поведения.
Отказ от ответственности
Информация и публикации не предназначены для предоставления и не являются финансовыми, инвестиционными, торговыми или другими видами советов или рекомендаций, предоставленных или одобренных TradingView. Подробнее читайте в Условиях использования.
Скрипт с открытым кодом
В истинном духе TradingView, создатель этого скрипта сделал его открытым исходным кодом, чтобы трейдеры могли проверить и убедиться в его функциональности. Браво автору! Вы можете использовать его бесплатно, но помните, что перепубликация кода подчиняется нашим Правилам поведения.
Отказ от ответственности
Информация и публикации не предназначены для предоставления и не являются финансовыми, инвестиционными, торговыми или другими видами советов или рекомендаций, предоставленных или одобренных TradingView. Подробнее читайте в Условиях использования.