OPEN-SOURCE SCRIPT
StdDev Channels

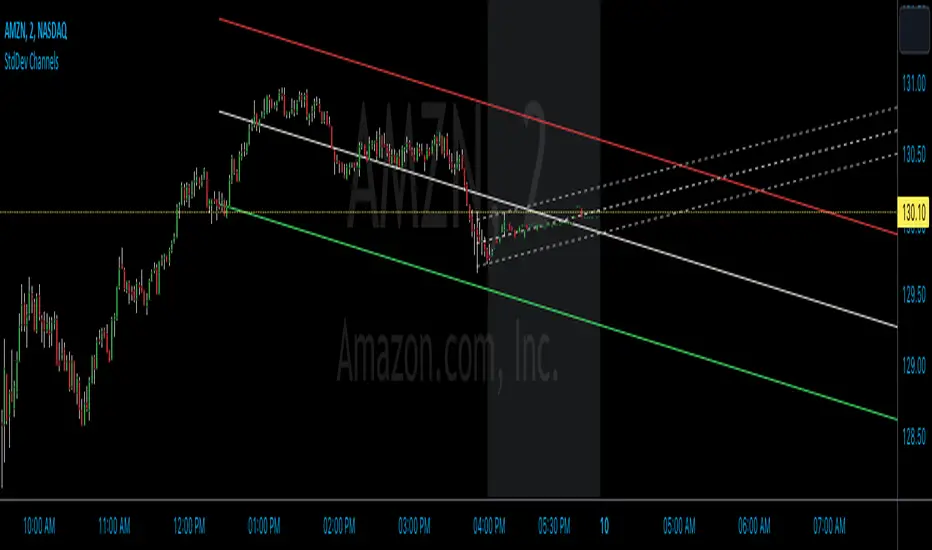
This script draws two sets of standard deviation channels on the price chart, providing a nuanced view of price volatility over different lengths.
The script starts by declaring a set of user-defined inputs allowing traders to customize the tool according to their individual requirements. The price input sets the source of the price data, defaulting to the closing price but customizable to use open, high, or low prices. The deviations parameter defines the width of the channels, with larger numbers resulting in wider channels. The length and length2 inputs represent the number of periods (in bars) that the script considers when calculating the regression line and standard deviation. Traders can also personalize the visual aspects of the indicator on the chart using the color, linewidth, and linestyle parameters.
Calculation of Standard Deviation:
The core of this script lies in calculating the regression line and standard deviation. This is where the InertiaAll function comes into play. This function calculates the linear regression line, which serves as the middle line of each channel. The function takes in two parameters: y (price data) and n (length for calculation). It returns an array containing the values for the regression line (InertiaTS), counter variable (x), slope of the line (a), and y-intercept (b). The standard deviation is then calculated using the built-in function ta.stdev, which measures the amount of variation or dispersion from the average.
After the calculation, the script proceeds to draw the channels. It creates two sets of lines (upper, middle, and lower) for each channel. These lines are initialized at the lowest price point on the chart (low). The coordinates for these lines get updated in the last section of the script, which runs only on the last bar on the chart (if barstate.islast). The functions line.set_xy1 and line.set_xy2 are used to adjust the starting and ending points for each line, forming the channels.
If the "full range" toggle is enabled, the script uses the maximum number of bars available on the chart to calculate the regression and standard deviation. This can give a broader perspective of the price's volatility over the entire available data range.
A Basic Strategy
The channels generated by this script may inform your trading decisions. If the price hits the upper line of a channel, it could suggest an 'overbought' condition indicating a potential selling opportunity. Conversely, if the price hits the lower line, it might signal an 'oversold' condition, suggesting a buying opportunity. The second channel, calculated over a different length, may serve to confirm these signals or identify longer-term trends.
Скрипт с открытым кодом
В истинном духе TradingView, создатель этого скрипта сделал его открытым исходным кодом, чтобы трейдеры могли проверить и убедиться в его функциональности. Браво автору! Вы можете использовать его бесплатно, но помните, что перепубликация кода подчиняется нашим Правилам поведения.
Отказ от ответственности
Информация и публикации не предназначены для предоставления и не являются финансовыми, инвестиционными, торговыми или другими видами советов или рекомендаций, предоставленных или одобренных TradingView. Подробнее читайте в Условиях использования.