PROTECTED SOURCE SCRIPT
Crimson/Grover Sine Cycle

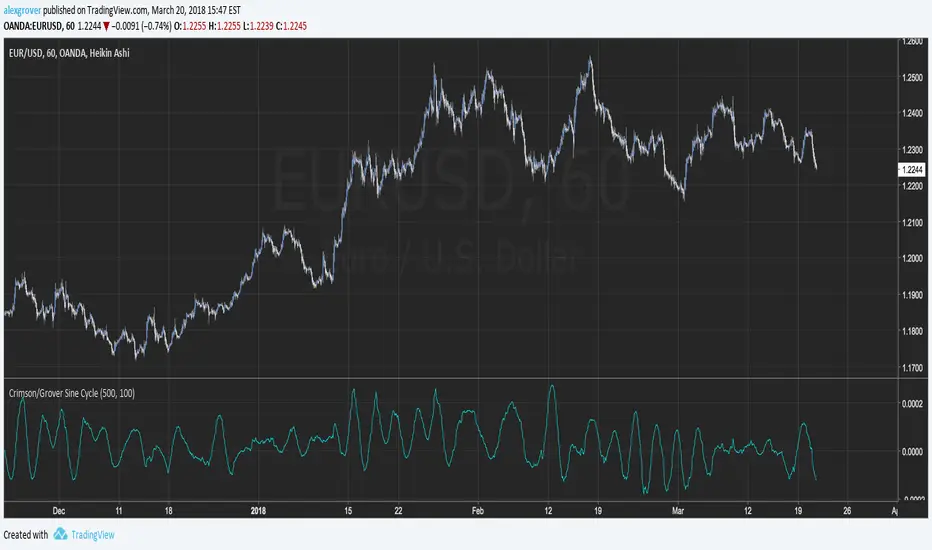
There is plenty of indicators trying to show cycles in price, the majority of them create a stationary version of the price and then smooth it, the Crimson/Grover cycle use as source a pure sine wave of period crimson and then use a best fit line with y = price and x = sine wave.Some final transformations are mades for highlights the cycle of the price.
The length parameter control the regression period and the crimson parameter the period of the sine cycle.If the length is higher than the crimson period then the indicator is more smoother but give more liberty to the sine wave.
The period of sine wave is equal to period/(2*3.14).

A sine wave of period 100
For any questions regarding the indicator please contact me :)
The length parameter control the regression period and the crimson parameter the period of the sine cycle.If the length is higher than the crimson period then the indicator is more smoother but give more liberty to the sine wave.
The period of sine wave is equal to period/(2*3.14).
A sine wave of period 100
For any questions regarding the indicator please contact me :)
Скрипт с защищённым кодом
Этот скрипт опубликован с закрытым исходным кодом. Однако вы можете использовать его свободно и без каких-либо ограничений — читайте подробнее здесь.
Check out the indicators we are making at luxalgo: tradingview.com/u/LuxAlgo/
"My heart is so loud that I can't hear the fireworks"
"My heart is so loud that I can't hear the fireworks"
Отказ от ответственности
Информация и публикации не предназначены для предоставления и не являются финансовыми, инвестиционными, торговыми или другими видами советов или рекомендаций, предоставленных или одобренных TradingView. Подробнее читайте в Условиях использования.