OPEN-SOURCE SCRIPT
Обновлено Bear Bull Ratio (BBR)
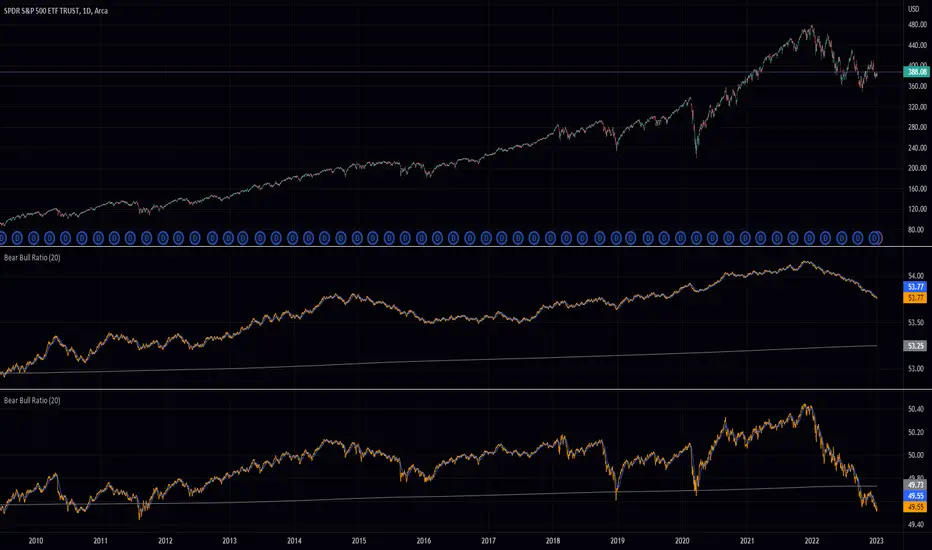
This indicator calculates the ratio of bearish to bullish candles over a certain window of time. It does this by keeping track of the number or distance (depending on the "Enable True Range Mode" input) between the high and low prices of bullish and bearish candles, respectively, and then dividing the total distance of bullish candles by the sum of the distances of both bullish and bearish candles. The resulting ratio is then plotted on the chart as a percentage. The indicator also plots a smoothed version of the ratio using a weighted moving average and the average of the ratio over the entire length of the chart, for both the "True Range Mode" and "Normal Mode".
Информация о релизе
typo fixСкрипт с открытым кодом
В истинном духе TradingView, создатель этого скрипта сделал его открытым исходным кодом, чтобы трейдеры могли проверить и убедиться в его функциональности. Браво автору! Вы можете использовать его бесплатно, но помните, что перепубликация кода подчиняется нашим Правилам поведения.
Отказ от ответственности
Информация и публикации не предназначены для предоставления и не являются финансовыми, инвестиционными, торговыми или другими видами советов или рекомендаций, предоставленных или одобренных TradingView. Подробнее читайте в Условиях использования.
Скрипт с открытым кодом
В истинном духе TradingView, создатель этого скрипта сделал его открытым исходным кодом, чтобы трейдеры могли проверить и убедиться в его функциональности. Браво автору! Вы можете использовать его бесплатно, но помните, что перепубликация кода подчиняется нашим Правилам поведения.
Отказ от ответственности
Информация и публикации не предназначены для предоставления и не являются финансовыми, инвестиционными, торговыми или другими видами советов или рекомендаций, предоставленных или одобренных TradingView. Подробнее читайте в Условиях использования.