OPEN-SOURCE SCRIPT
Seasonality Charts
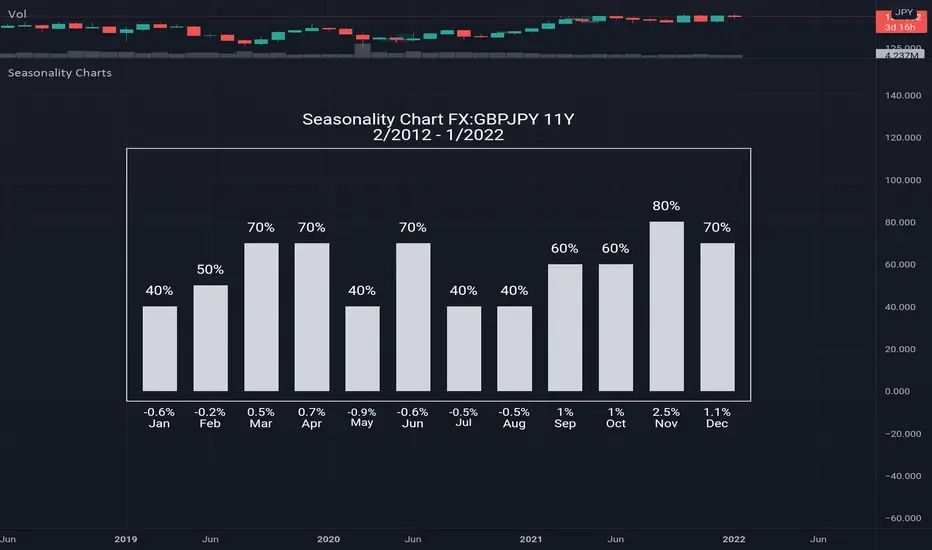
How to use: open monthly chart
What this chart show: The seasonality tool calculates two numbers: the percentage of time that the month is positive above histogram and the average gain/loss for the month below histogram
Seasonality tells us what has happened in the past, which is the historical tendency. There is certainly no guarantee that past performance will equal future performance, but traders can look for above average tendencies to complement other signals. On the face of it, a bullish bias is present when a security shows gains more than 50% of the time for a particular month. Conversely, a bearish bias is present when a security rises less than 50% of the time. While 50% represents the exact middle, chartists should look for more extreme readings that suggest a relatively strong tendency.
Скрипт с открытым кодом
В истинном духе TradingView, создатель этого скрипта сделал его открытым исходным кодом, чтобы трейдеры могли проверить и убедиться в его функциональности. Браво автору! Вы можете использовать его бесплатно, но помните, что перепубликация кода подчиняется нашим Правилам поведения.
Отказ от ответственности
Информация и публикации не предназначены для предоставления и не являются финансовыми, инвестиционными, торговыми или другими видами советов или рекомендаций, предоставленных или одобренных TradingView. Подробнее читайте в Условиях использования.