OPEN-SOURCE SCRIPT
Обновлено Manipulation Day [Alex Ko]
🇺🇸 Description
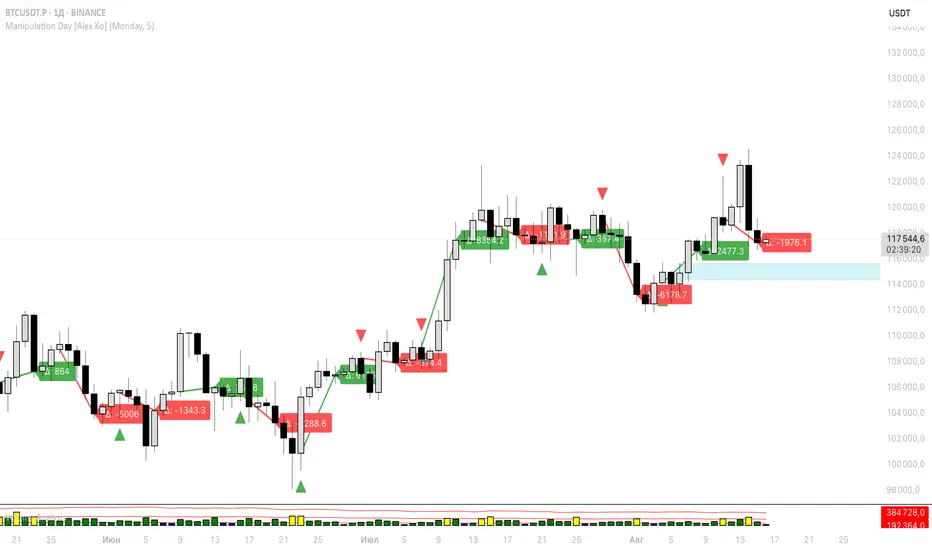
Indicator “Manipulation Day”
This indicator helps you detect a potential manipulation day (e.g. Monday) and track the price reaction afterward.
📌 Features:
Select any weekday as a manipulation day.
Wait for N candles after it.
If the manipulation day closes higher than it opened — a green triangle appears. If lower — red triangle.
After N days, a line is drawn from the next day's open to the close — green if price increased, red if dropped.
A label shows the delta (Δ) between open and close for that range.
🧠 Useful for spotting potential trap setups or liquidity grabs followed by directional moves.
Информация о релизе
This indicator helps you detect a potential manipulation day (e.g. Monday) and track the price reaction afterward.📌 Features:
Select any weekday as a manipulation day.
Wait for N candles after it.
If the manipulation day closes higher than it opened — a green triangle appears. If lower — red triangle.
After N days, a line is drawn from the next day's open to the close — green if price increased, red if dropped.
A label shows the delta (Δ) between open and close for that range.
🧠 Useful for spotting potential trap setups or liquidity grabs followed by directional moves.
Информация о релизе
upd vsaСкрипт с открытым кодом
В истинном духе TradingView автор этого скрипта опубликовал его с открытым исходным кодом, чтобы трейдеры могли понять, как он работает, и проверить на практике. Вы можете воспользоваться им бесплатно, но повторное использование этого кода в публикации регулируется Правилами поведения.
Отказ от ответственности
Все виды контента, которые вы можете увидеть на TradingView, не являются финансовыми, инвестиционными, торговыми или любыми другими рекомендациями. Мы не предоставляем советы по покупке и продаже активов. Подробнее — в Условиях использования TradingView.
Скрипт с открытым кодом
В истинном духе TradingView автор этого скрипта опубликовал его с открытым исходным кодом, чтобы трейдеры могли понять, как он работает, и проверить на практике. Вы можете воспользоваться им бесплатно, но повторное использование этого кода в публикации регулируется Правилами поведения.
Отказ от ответственности
Все виды контента, которые вы можете увидеть на TradingView, не являются финансовыми, инвестиционными, торговыми или любыми другими рекомендациями. Мы не предоставляем советы по покупке и продаже активов. Подробнее — в Условиях использования TradingView.