OPEN-SOURCE SCRIPT
Custom Fibonacci Strategy
Custom Fibonacci Strategy:
This strategy relies on analyzing Fibonacci levels to identify entry points for trades. It works by identifying peaks and troughs over a specified time period (50 bars in this code). Here are the steps of the strategy:
Identifying Peaks and Troughs:
The highest peak and lowest trough over the last 50 bars are identified.
If the price exceeds the previous peak, it is considered a break of the peak.
If the price falls below the previous trough after breaking the peak, it is considered a break of the trough.
Calculating Fibonacci Levels:
The 50% level (midway point) between the identified peak and trough is calculated.
Buy Signals:
When a trough is broken, and the price trades at or below the 50% level, the risk-to-reward ratio is evaluated.
If the risk-to-reward ratio is greater than or equal to 2, a buy signal is generated.
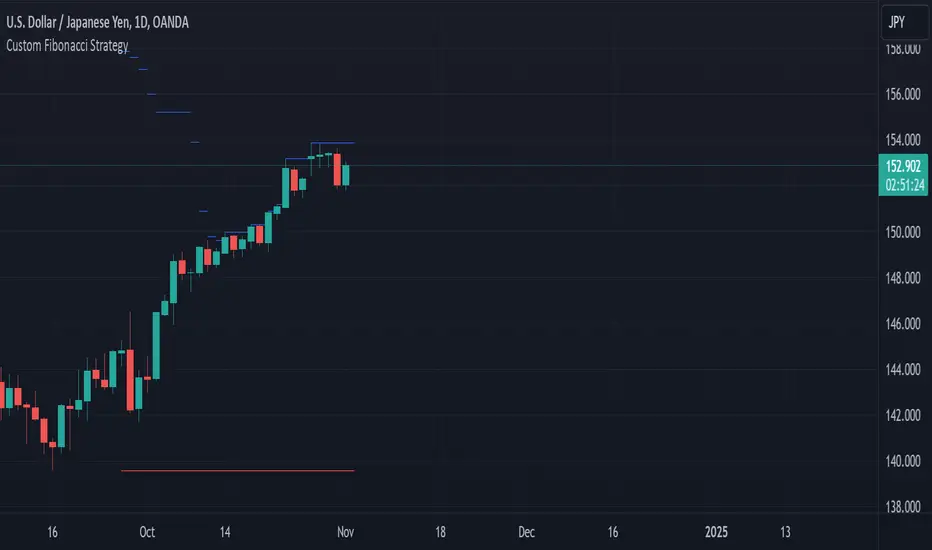
Displaying Levels:
Horizontal lines are displayed on the chart to illustrate the peak, trough, and Fibonacci level.
Summary
This strategy provides a systematic approach to trading based on Fibonacci retracement levels and price action, allowing traders to make informed decisions about entry points and manage risk effectively.
This strategy relies on analyzing Fibonacci levels to identify entry points for trades. It works by identifying peaks and troughs over a specified time period (50 bars in this code). Here are the steps of the strategy:
Identifying Peaks and Troughs:
The highest peak and lowest trough over the last 50 bars are identified.
If the price exceeds the previous peak, it is considered a break of the peak.
If the price falls below the previous trough after breaking the peak, it is considered a break of the trough.
Calculating Fibonacci Levels:
The 50% level (midway point) between the identified peak and trough is calculated.
Buy Signals:
When a trough is broken, and the price trades at or below the 50% level, the risk-to-reward ratio is evaluated.
If the risk-to-reward ratio is greater than or equal to 2, a buy signal is generated.
Displaying Levels:
Horizontal lines are displayed on the chart to illustrate the peak, trough, and Fibonacci level.
Summary
This strategy provides a systematic approach to trading based on Fibonacci retracement levels and price action, allowing traders to make informed decisions about entry points and manage risk effectively.
Скрипт с открытым кодом
В истинном духе TradingView, создатель этого скрипта сделал его открытым исходным кодом, чтобы трейдеры могли проверить и убедиться в его функциональности. Браво автору! Вы можете использовать его бесплатно, но помните, что перепубликация кода подчиняется нашим Правилам поведения.
Отказ от ответственности
Информация и публикации не предназначены для предоставления и не являются финансовыми, инвестиционными, торговыми или другими видами советов или рекомендаций, предоставленных или одобренных TradingView. Подробнее читайте в Условиях использования.