OPEN-SOURCE SCRIPT
Market Structures by The Noiseless Trader
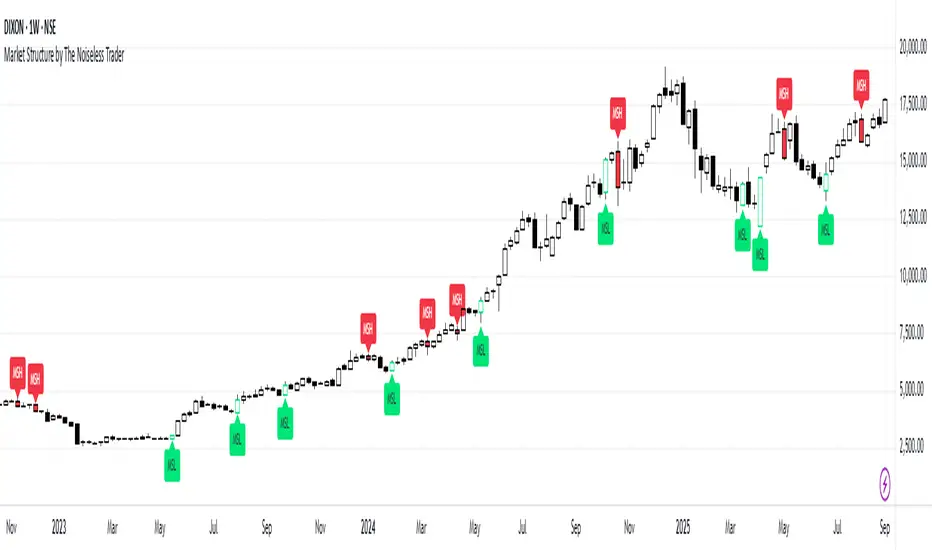
Market Structure by The Noiseless Trader is an indicator that highlights simple candle-based market structure patterns: Market Structure Low (MSL) and Market Structure High (MSH). It is designed to make these shifts visible directly on the chart.
Pattern Logic
MSL (Market Structure Low)
MSH (Market Structure High)
Features
How to Use
These patterns are most useful for studying shifts in short-term trend structure. Traders can monitor them as potential areas of interest, but they are not standalone entry or exit signals.
This indicator should be used as part of a broader trading framework. For example, some traders may combine MSL/MSH with trend filters, higher-timeframe analysis, or support/resistance zones or even classical pattern clubbed with MSL/MSH.
Notes
Developed by The Noiseless Trader.
Pattern Logic
MSL (Market Structure Low)
- Candle 2: Bearish
- Candle 1: Bearish, closing below Candle 2’s close
- Candle 0: Bullish, closing above Candle 1’s open
- Candle 0 must also have a minimum body size (default = 2%)
MSH (Market Structure High)
- Candle 2: Bullish
- Candle 1: Bullish, closing above Candle 2’s close
- Candle 0: Bearish, closing below Candle 1’s open
- Candle 0 must also have a minimum body size (default = 2%)
Features
- Label plotting: When a pattern forms, the script places an “MSL” or “MSH” label slightly offset from Candle 0 so that the signal is visible but does not overlap the bar.
- Bar coloring: Optionally, the script colors the signal candles for faster visual recognition (green for MSL, red for MSH).
- Repaint protection: A setting allows the user to confirm signals only on bar close. This ensures the label does not disappear once plotted, though it delays the signal until the candle closes.
- Customizable inputs: Users can set the minimum body size threshold (in % of price) and adjust the label offset distance to their preference.
- Alerts: TradingView alerts can be created for both MSL and MSH events, making it possible to receive notifications when patterns appear.
How to Use
- MSL labels mark potential swing lows where bearish pressure is followed by a bullish reversal.
- MSH labels mark potential swing highs where bullish pressure is followed by a bearish reversal.
These patterns are most useful for studying shifts in short-term trend structure. Traders can monitor them as potential areas of interest, but they are not standalone entry or exit signals.
This indicator should be used as part of a broader trading framework. For example, some traders may combine MSL/MSH with trend filters, higher-timeframe analysis, or support/resistance zones or even classical pattern clubbed with MSL/MSH.
Notes
- This tool highlights specific three-candle formations. It does not generate buy/sell recommendations.
- It is intended for educational and analytical purposes only.
- Past appearances of MSL or MSH patterns do not guarantee future performance.
- Always confirm with your own market analysis before taking trading decisions.
Developed by The Noiseless Trader.
Скрипт с открытым кодом
В истинном духе TradingView, создатель этого скрипта сделал его открытым исходным кодом, чтобы трейдеры могли проверить и убедиться в его функциональности. Браво автору! Вы можете использовать его бесплатно, но помните, что перепубликация кода подчиняется нашим Правилам поведения.
The Noiseless Trader — Structure first. Then price. Then confirmation. | Explore more with TNT One thenoiselesstrader.com/s/pages/tntone | An extensive library of 200+ hours of actionable financial market knowledge
Отказ от ответственности
Информация и публикации не предназначены для предоставления и не являются финансовыми, инвестиционными, торговыми или другими видами советов или рекомендаций, предоставленных или одобренных TradingView. Подробнее читайте в Условиях использования.