PROTECTED SOURCE SCRIPT
Обновлено Equal Highs/Lows

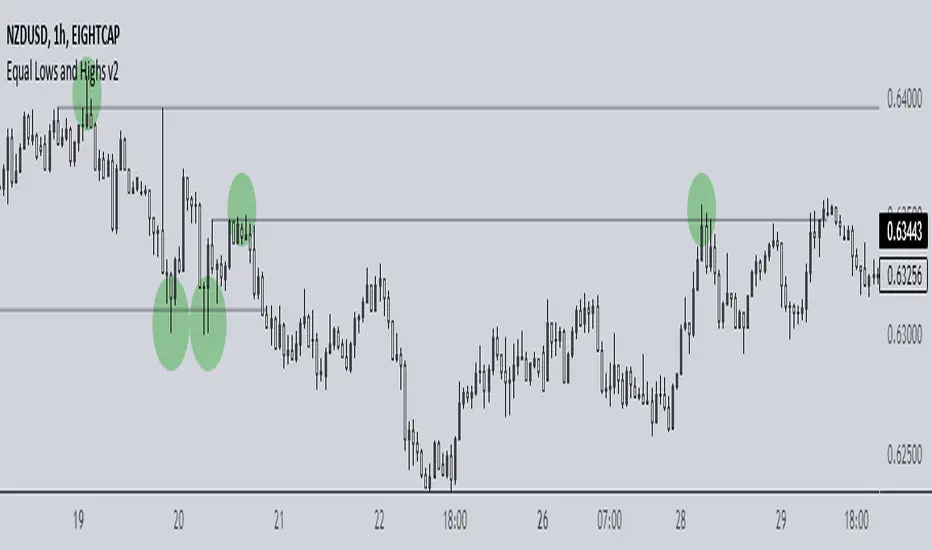
This indicator checks for equal highs/lows using the previous three pivots at any given time. This is helpful for identifying where liquidity lies and where a likely sweep/SFP may occur.
You can choose the bar size for the pivots to check for in order to detect desirable levels as well as adjust the acceptable deviation for near-equal highs/lows.
By default, the settings are ideal for BTC in the 5-15m charts. Deviation would need to be set in the decimals for lower-priced symbols and experimentation is recommended.
Информация о релизе
- Updated script to avoid redrawing levels- Replaced "tracking" with labels
- Added option to check for equal highs/lows on consecutive candles
Информация о релизе
Added ability to change eqh/l colorsИнформация о релизе
This script has been completely redone to reduce complexity. Now checks for equal highs/low, plots, and removes them if future prices exceed them.Информация о релизе
Added symbol to eqh/ls to represent liquidityИнформация о релизе
This indicator should now work with all symbols - feel free to provide feedback if there are any issuesИнформация о релизе
- Reduced number of lines (previously 500 and now 15)- Added option to adjust sensitivity on equal highs/lows
Информация о релизе
Added alertsИнформация о релизе
- Added tooltip for indicator sensitivity input- Removed liquidity label/text color from inputs
Информация о релизе
Added input for max linesИнформация о релизе
- Updated input grouping- Added alerts options if you exclusively want equal highs or lows
Информация о релизе
Shows equal highs and lows which usually indicates a large amount of liquidity beyond them. This information can guide decisions when price sweeps these areas then reverses direction (SFPs). In addition, these areas may indicate a potential break up/down as price fails to hold beneath/above.Improvements include:
- New codebase to detect equal lows/highs
- Shows historical areas for easier backtesting
- Granular input for sensitivity based on timeframe
Информация о релизе
Added the option for symbols in addition to the usual lines Скрипт с защищённым кодом
Этот скрипт опубликован с закрытым исходным кодом. Однако вы можете использовать его свободно и без каких-либо ограничений — читайте подробнее здесь.
Отказ от ответственности
Все виды контента, которые вы можете увидеть на TradingView, не являются финансовыми, инвестиционными, торговыми или любыми другими рекомендациями. Мы не предоставляем советы по покупке и продаже активов. Подробнее — в Условиях использования TradingView.
Скрипт с защищённым кодом
Этот скрипт опубликован с закрытым исходным кодом. Однако вы можете использовать его свободно и без каких-либо ограничений — читайте подробнее здесь.
Отказ от ответственности
Все виды контента, которые вы можете увидеть на TradingView, не являются финансовыми, инвестиционными, торговыми или любыми другими рекомендациями. Мы не предоставляем советы по покупке и продаже активов. Подробнее — в Условиях использования TradingView.