OPEN-SOURCE SCRIPT
20 Week SMA Risk Rating
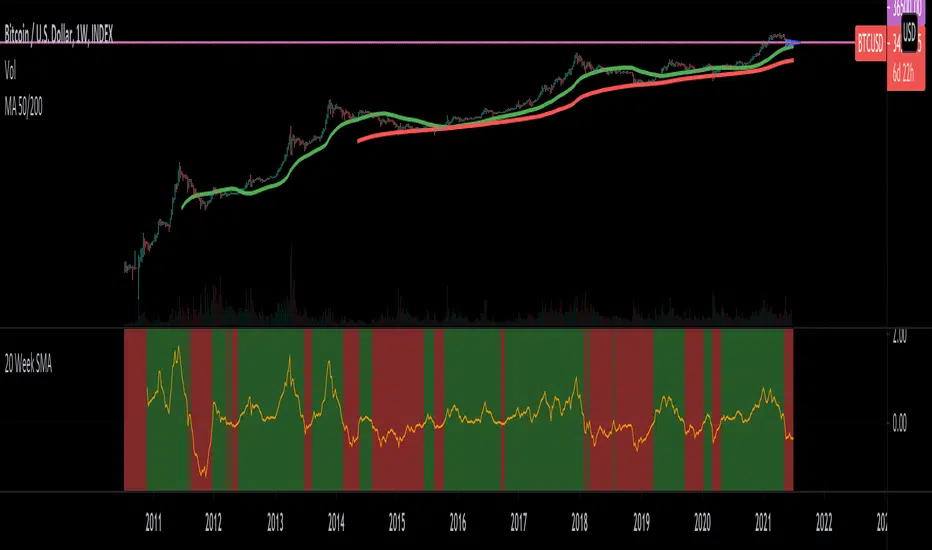
Use this indicator in the Weekly graph.
Green background indicates we are above the 20-day SMA; red background indicates we are under the 20-day SMA.
The lower we are the 20-day SMA indicates the bottom is near. The higher we are the 20-day SMA indicates there's the possibility to start climbing down.
Green background indicates we are above the 20-day SMA; red background indicates we are under the 20-day SMA.
The lower we are the 20-day SMA indicates the bottom is near. The higher we are the 20-day SMA indicates there's the possibility to start climbing down.
Скрипт с открытым кодом
В истинном духе TradingView, создатель этого скрипта сделал его открытым исходным кодом, чтобы трейдеры могли проверить и убедиться в его функциональности. Браво автору! Вы можете использовать его бесплатно, но помните, что перепубликация кода подчиняется нашим Правилам поведения.
Отказ от ответственности
Информация и публикации не предназначены для предоставления и не являются финансовыми, инвестиционными, торговыми или другими видами советов или рекомендаций, предоставленных или одобренных TradingView. Подробнее читайте в Условиях использования.