OPEN-SOURCE SCRIPT
Обновлено Webby's RSI (Really Simple Indicator) [LevelUp]
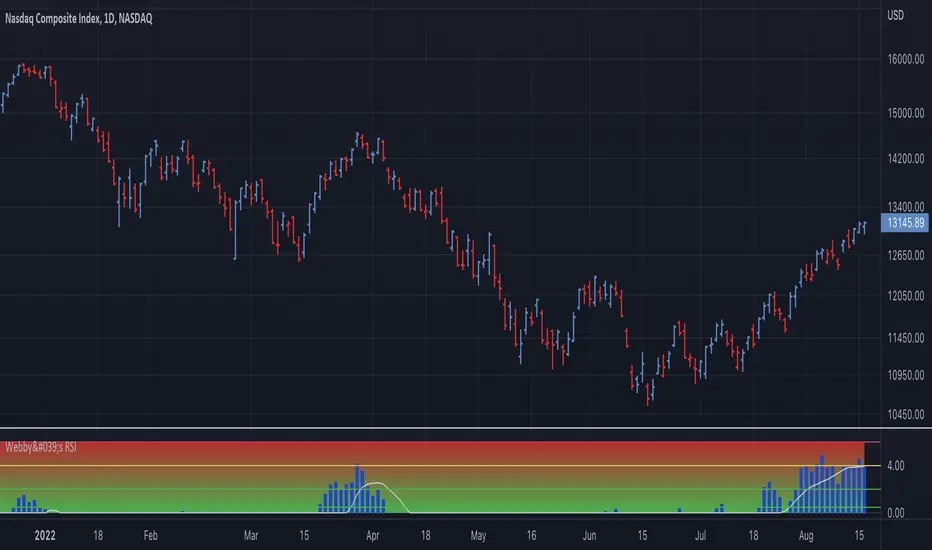
Webby's RSI (Really Simple Indicator) is a technical indicator designed to gauge the health of an uptrend. The concept and original implementation was created by Mike Webster, previously a portfolio manager for William O'Neil, founder of Investor's Business Daily.
Most often used with the Nasdaq Composite (IXIC), Webby's RSI is the percentage of the low versus the 21-day moving average. At the beginning of a bull market, the higher the value, the better, as we want to see power.
Using the zones shown on the chart:
0.5% and 2.0% - Ideal
2.0% to 4.0% - Caution
4.0%+ - Warning
Информация о релизе
Version 2.0▪ Optional background color shown as a gradient.
▪ Customize plot type, color & moving average.
▪ Show/hide zone lines.
Скрипт с открытым кодом
В истинном духе TradingView, создатель этого скрипта сделал его открытым исходным кодом, чтобы трейдеры могли проверить и убедиться в его функциональности. Браво автору! Вы можете использовать его бесплатно, но помните, что перепубликация кода подчиняется нашим Правилам поведения.
Join traders in over 40 countries and LevelUp!
tradingview.com/spaces/LevelUpTools/
tradingview.com/spaces/LevelUpTools/
Отказ от ответственности
Информация и публикации не предназначены для предоставления и не являются финансовыми, инвестиционными, торговыми или другими видами советов или рекомендаций, предоставленных или одобренных TradingView. Подробнее читайте в Условиях использования.