OPEN-SOURCE SCRIPT
Обновлено Donchian Channels with Strategy
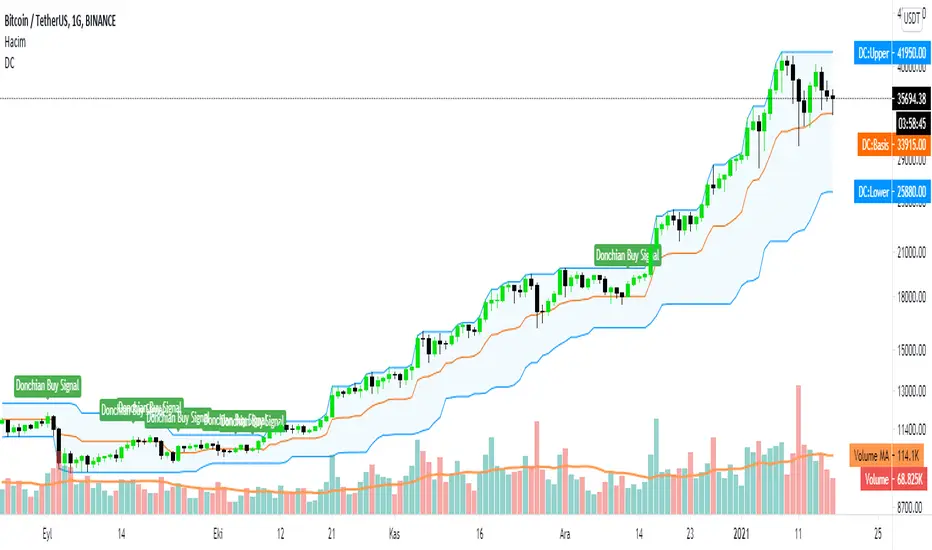
Donchian Channels are three lines generated by moving average calculations that comprise an indicator formed by upper and lower bands around a mid-range or median band. The upper band marks the highest price of a security over N periods while the lower band marks the lowest price of a security over N periods. The area between the upper and lower bands represents the Donchian Channel. Career futures trader Richard Donchian developed the indicator in the mid-twentieth century to help him identify trends. He would later be nicknamed "The Father of Trend Following."
How To Calculate Donchian Channels
Channel High:
Choose time period (N minutes/hours/days/weeks/months).
Compare the high print for each minute, hour, day, week or month over that period.
Choose the highest print.
Plot the result.
Channel Low:
Choose time period (N minutes/hours/days/weeks/months).
Compare the low print for each minute, hour, day, week or month over that period.
Choose the lowest print.
Plot the result.
Center Channel:
Choose time period (N minutes/hours/days/weeks/months).
Compare high and low prints for each minute, hour, day, week or month over that period.
Subtract the highest high print from lowest low print and divide by 2.
Plot the result.
This scripts gives you to alerts
If price above the center channel this means BUY and script tells you are at the BUY ZONE
Информация о релизе
In this version we changed some tickets name and made some bug fixes.Скрипт с открытым кодом
В истинном духе TradingView, создатель этого скрипта сделал его открытым исходным кодом, чтобы трейдеры могли проверить и убедиться в его функциональности. Браво автору! Вы можете использовать его бесплатно, но помните, что перепубликация кода подчиняется нашим Правилам поведения.
Отказ от ответственности
Информация и публикации не предназначены для предоставления и не являются финансовыми, инвестиционными, торговыми или другими видами советов или рекомендаций, предоставленных или одобренных TradingView. Подробнее читайте в Условиях использования.
Скрипт с открытым кодом
В истинном духе TradingView, создатель этого скрипта сделал его открытым исходным кодом, чтобы трейдеры могли проверить и убедиться в его функциональности. Браво автору! Вы можете использовать его бесплатно, но помните, что перепубликация кода подчиняется нашим Правилам поведения.
Отказ от ответственности
Информация и публикации не предназначены для предоставления и не являются финансовыми, инвестиционными, торговыми или другими видами советов или рекомендаций, предоставленных или одобренных TradingView. Подробнее читайте в Условиях использования.