OPEN-SOURCE SCRIPT
Buy/Sell Signals for CM_Williams_Vix_Fix

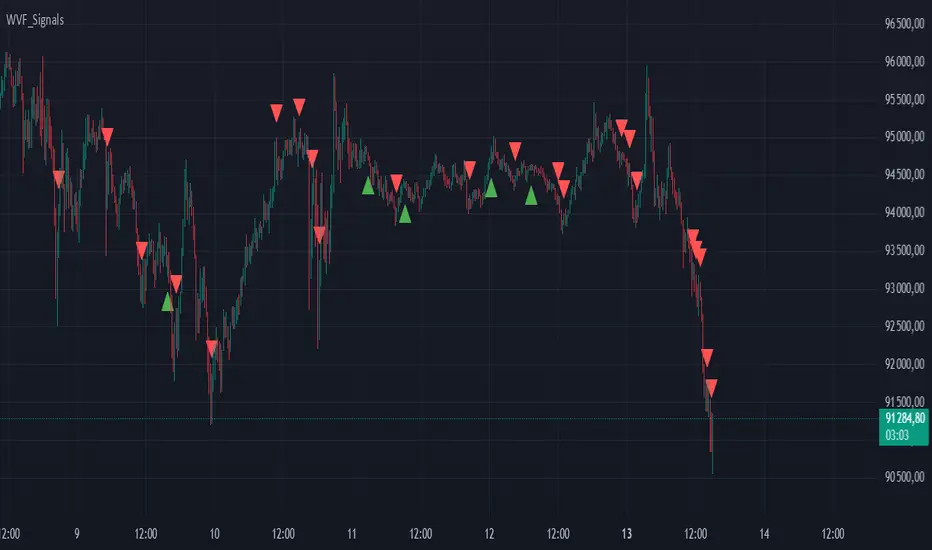
This script in Pine Script is designed to create an indicator that generates buy and sell signals based on the Williams VIX Fix (WVF) indicator. Here’s a brief explanation of how this script works:
Main Components:
Williams VIX Fix (WVF) – This volatility indicator is calculated using the formula:
WVF
=
(
highest(close, pd)
−
low
highest(close, pd)
)
×
100
WVF=(
highest(close, pd)
highest(close, pd)−low
)×100
where highest(close, pd) represents the highest closing price over the period pd, and low represents the lowest price over the same period.
Bollinger Bands are used to determine levels of overbought and oversold conditions. They are constructed around the moving average (SMA) of the WVF value using standard deviation (SD).
Ranges based on percentiles help identify extreme levels of WVF values to spot entry and exit points.
Buy and sell signals are generated when the WVF crosses the Bollinger Bands lines or reaches the ranges based on percentiles.
Adjustable Parameters:
LookBack Period Standard Deviation High (pd): The lookback period for calculating the highest closing price.
Bolinger Band Length (bbl): The length of the period for constructing the Bollinger Bands.
Bollinger Band Standard Devaition Up (mult): The multiplier for the standard deviation used for the upper Bollinger Band.
Look Back Period Percentile High (lb): The lookback period for calculating maximum and minimum WVF values.
Highest Percentile (ph): The percentile threshold for determining the high level.
Lowest Percentile (pl): The percentile threshold for determining the low level.
Show High Range (hp): Option to display the range based on percentiles.
Show Standard Deviation Line (sd): Option to display the standard deviation line.
Signals:
Buy Signal: Generated when the WVF crosses above the lower Bollinger Band or falls below the lower boundary of the percentile-based range.
Sell Signal: Generated when the WVF crosses below the upper Bollinger Band or rises above the upper boundary of the percentile-based range.
These signals are displayed as triangles below or above the candles respectively.
Application:
The script can be used by traders to analyze market conditions and make buying or selling decisions based on volatility and price behavior.
Скрипт с открытым кодом
В истинном духе TradingView, создатель этого скрипта сделал его открытым исходным кодом, чтобы трейдеры могли проверить и убедиться в его функциональности. Браво автору! Вы можете использовать его бесплатно, но помните, что перепубликация кода подчиняется нашим Правилам поведения.
Отказ от ответственности
Информация и публикации не предназначены для предоставления и не являются финансовыми, инвестиционными, торговыми или другими видами советов или рекомендаций, предоставленных или одобренных TradingView. Подробнее читайте в Условиях использования.