OPEN-SOURCE SCRIPT
Anomaly Detector
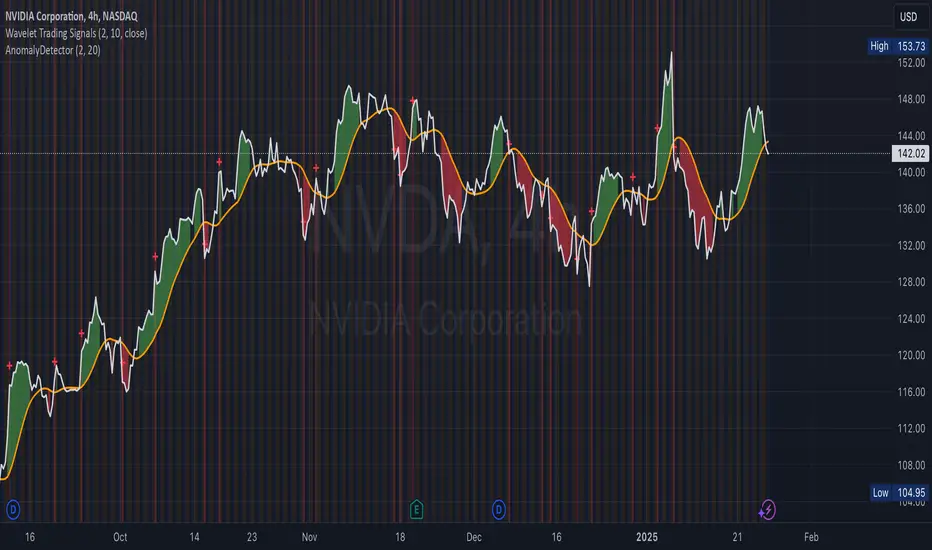
Price Anomaly Detector
This is a script designed to identify unusual price movements. By analyzing deviations from typical price behavior, this tool helps traders spot potential trading opportunities and manage risks effectively.
---
Features
- Anomaly Detection: Flags price points that significantly deviate from the average.
- Visual Indicators: Highlights anomalies with background colors and cross markers.
- Customizable Settings: Adjust sensitivity and window size to match your trading strategy.
- Real-Time Analysis: Continuously updates anomaly signals as new data is received.
---
Usage
After adding the indicator to your chart:
1. View Anomalies: Red backgrounds and cross markers indicate detected anomalies.
2. Adjust Settings: Modify the `StdDev Threshold` and `Window Length` to change detection sensitivity.
3. Interpret Signals:
- Red Background: Anomaly detected on that bar.
- Red Cross: Specific point of anomaly.
---
Inputs
- StdDev Threshold: Higher values reduce anomaly sensitivity. Default: 2.0.
- Window Length: Larger windows smooth data, reducing false positives. Default: 20.
---
Limitations
- Approximation Method: Uses a simple method to detect anomalies, which may not capture all types of unusual price movements.
- Performance: Extremely large window sizes may impact script performance.
- Segment Detection: Does not group consecutive anomalies into segments.
---
Disclaimer: This tool is for educational purposes only. Trading involves risk, and you should perform your own analysis before making decisions. The author is not liable for any losses incurred.
Скрипт с открытым кодом
В истинном духе TradingView, создатель этого скрипта сделал его открытым исходным кодом, чтобы трейдеры могли проверить и убедиться в его функциональности. Браво автору! Вы можете использовать его бесплатно, но помните, что перепубликация кода подчиняется нашим Правилам поведения.
Отказ от ответственности
Информация и публикации не предназначены для предоставления и не являются финансовыми, инвестиционными, торговыми или другими видами советов или рекомендаций, предоставленных или одобренных TradingView. Подробнее читайте в Условиях использования.