OPEN-SOURCE SCRIPT
last week high and low
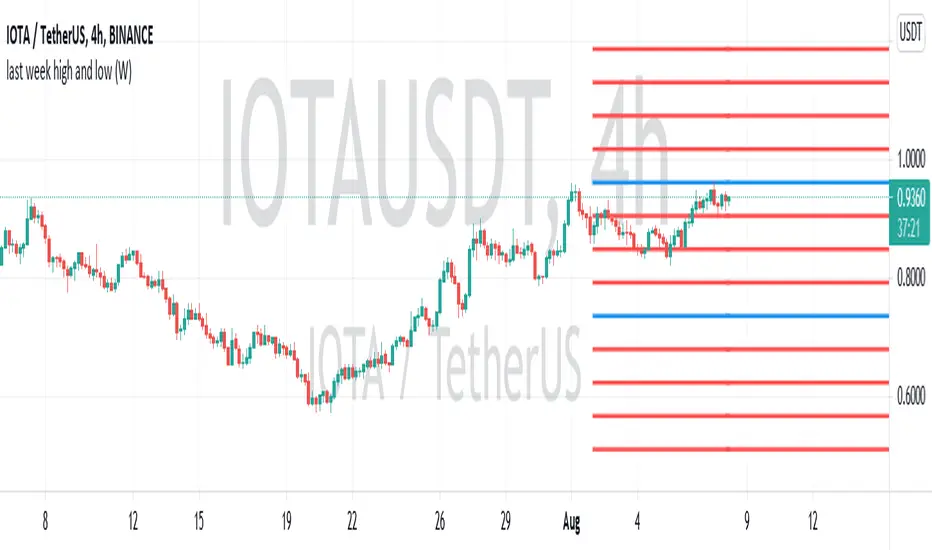
this script defines the highest and the lowest values of the last week. then illustrate and extend them into current week and future. they are define by blue lines.
in addition, the distance between high and low divided by 4. interior and exterior regions are split by these lines (red lines)
all lines can be considered as static support/resistance.
in addition, the distance between high and low divided by 4. interior and exterior regions are split by these lines (red lines)
all lines can be considered as static support/resistance.
Скрипт с открытым кодом
В истинном духе TradingView, создатель этого скрипта сделал его открытым исходным кодом, чтобы трейдеры могли проверить и убедиться в его функциональности. Браво автору! Вы можете использовать его бесплатно, но помните, что перепубликация кода подчиняется нашим Правилам поведения.
Отказ от ответственности
Информация и публикации не предназначены для предоставления и не являются финансовыми, инвестиционными, торговыми или другими видами советов или рекомендаций, предоставленных или одобренных TradingView. Подробнее читайте в Условиях использования.