OPEN-SOURCE SCRIPT
CM_Blast_Off_V1_Alerts Ready
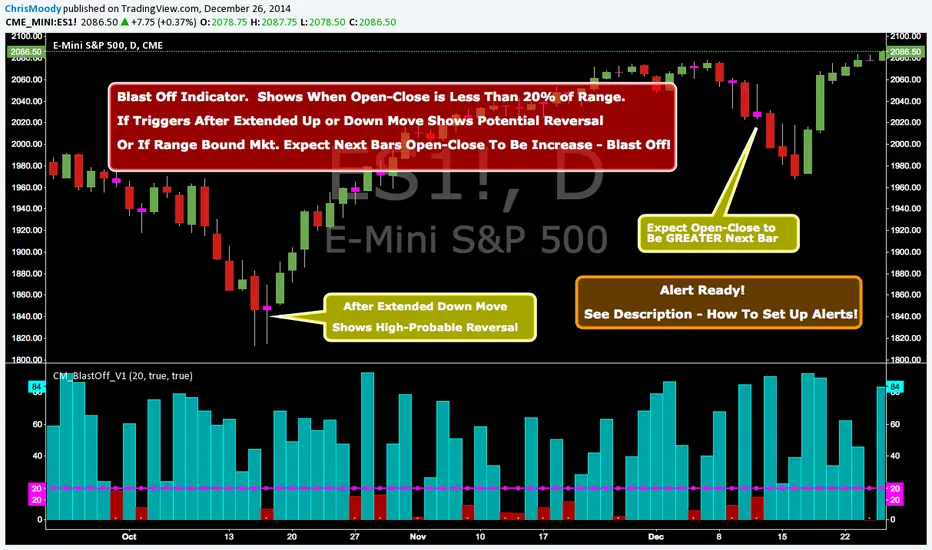
Blast Off Indicator - Alert Ready!!!
Created By Request from @elpuerto936c
Description of Indicator:
***This measures the day's open / close vs then high lows of the day (range)
***When the open /close is less than 20% of the range, then it's likely that the following day will have a big jump.
***The Thought Process is Simply When (Open - Close) is Less Than 20% Of The Range…Shows Indecision and Breakout is Probable.
***Which way? Use whatever indicator you want to figure out if the market is oversold or overbought.
***NOTE: If Indicator Triggers After Extended Up or Down Move…This = High Probability Reversal.
In Inputs Tab:
-Ability to Change The Trigger Value…(This is Percent The (Open-Close) is to the Total RANGE of The Bar).
-Ability to Turn On/Off Highlight Bars via Check Box.
To Set Alert:
-In First Drop Down Box Select Name of Indicator
-In Drop Down to Right Select “Alert Blast Off If Below Trigger”.
-Then Select “Greater Than”.
-Then Select “Value”
-To the Right of Value type in .99
-Select On Bar Close, If not you will get FALSE Alerts.
Скрипт с открытым кодом
В истинном духе TradingView, создатель этого скрипта сделал его открытым исходным кодом, чтобы трейдеры могли проверить и убедиться в его функциональности. Браво автору! Вы можете использовать его бесплатно, но помните, что перепубликация кода подчиняется нашим Правилам поведения.
Coming Soon: ChrisMoodyTrading.com
Отказ от ответственности
Информация и публикации не предназначены для предоставления и не являются финансовыми, инвестиционными, торговыми или другими видами советов или рекомендаций, предоставленных или одобренных TradingView. Подробнее читайте в Условиях использования.