OPEN-SOURCE SCRIPT
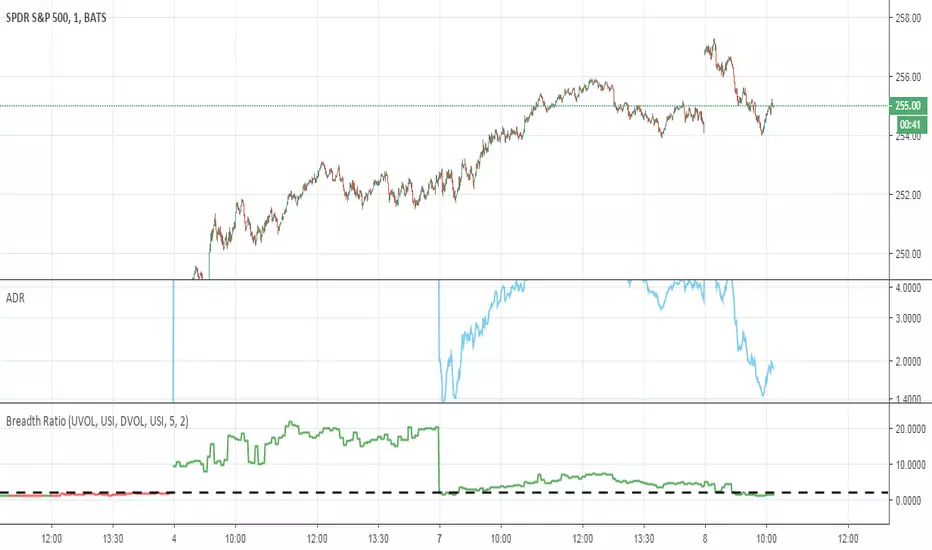
Advance Decline Vol Breadth Ratio - Satinder

This is ratio of aggregated volume of number of advances to the aggregated volume of number of declines. For e.g if Advance Decline ratio is 1, which means 50% of the stocks are advancing and 50% are declining, but there is more volume flowing into the advancing stocks, the market will move up. This ratio helps you gauge the market direction and can be used in combination of other breadth indicators.
--------------
The Breadth Ratio is a volume ratio composed of volume flowing into up stocks versus volume flowing into down stocks. This gives me a ratio that helps me gauge how strong the market will move in a particular direction for that particular day.
- For a STRONG POSITIVE trending day, I would want to see this ratio at a value of at least 2:1 positive; This means that we have 2x the amount of volume flowing into names moving higher on the session when compared to volume going into names moving lower.
-The opposite is true for a weak session moving lower; In that case, I would want to see at least 2:1 negative,This means that 2x the amount of volume is flowing into names moving lower on the session when compared to volume going into names moving higher.
Courtesy RobertTrader
Скрипт с открытым кодом
В истинном духе TradingView, создатель этого скрипта сделал его открытым исходным кодом, чтобы трейдеры могли проверить и убедиться в его функциональности. Браво автору! Вы можете использовать его бесплатно, но помните, что перепубликация кода подчиняется нашим Правилам поведения.
Отказ от ответственности
Информация и публикации не предназначены для предоставления и не являются финансовыми, инвестиционными, торговыми или другими видами советов или рекомендаций, предоставленных или одобренных TradingView. Подробнее читайте в Условиях использования.