OPEN-SOURCE SCRIPT
Обновлено Multi-Timeframe Trend Status
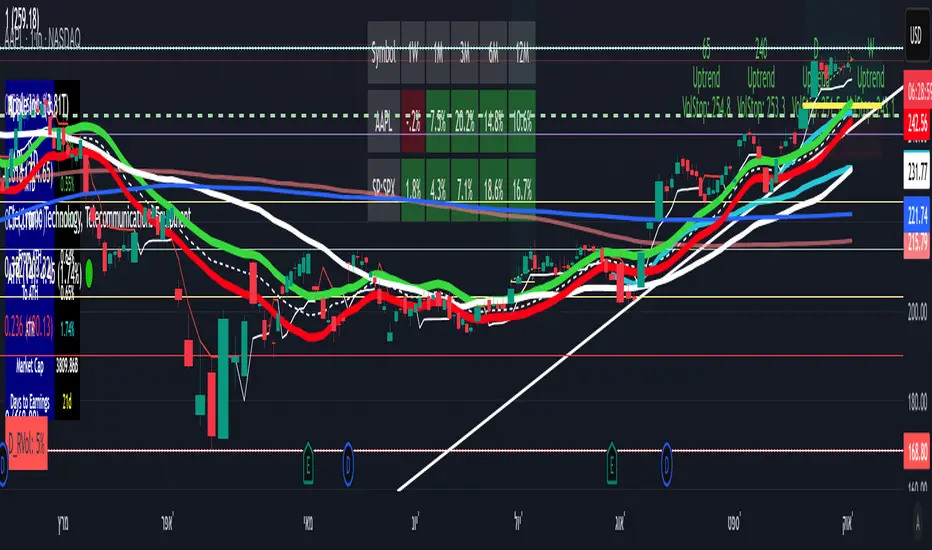
This Multi-Timeframe Trend Status indicator tracks market trends across four timeframes ( by default, 65-minute, 240-minute, daily, and monthly). It uses a Volatility Stop based on the Average True Range (ATR) to determine the trend direction. The ATR is multiplied by a user-adjustable multiplier to create a dynamic buffer zone that filters out market noise.
The indicator tracks the volatility stop and trend direction for each timeframe. In an uptrend, the stop trails below the price, adjusting upward, and signals a downtrend if the price falls below it. In a downtrend, the stop trails above the price, moving down with the market, and signals an uptrend if the price rises above it.
Two input parameters allow for customization:
ATR Length: Defines the period for ATR calculation.
ATR Multiplier: Adjusts the sensitivity of trend changes.
This setup lets traders align short-term decisions with long-term market context and spot potential trading opportunities or reversals.
Информация о релизе
Fixed a bug; the indicator results should not be affected by the graph's time frame. More option for user preferences.Информация о релизе
In this version some bugs are fixed.Multi-Timeframe Trend Status indicator that tracks market trends across four timeframes ( by default, 65-minute, 240-minute, daily, and monthly). It uses a Volatility Stop based on the Average True Range (ATR) to determine the trend direction. The ATR is multiplied by a user-adjustable multiplier to create a dynamic buffer zone that filters out market noise.
The indicator tracks the volatility stop and trend direction for each timeframe. In an uptrend, the stop trails below the price, adjusting upward, and signals a downtrend if the price falls below it. In a downtrend, the stop trails above the price, moving down with the market, and signals an uptrend if the price rises above it. The indicator output is presented in a table that indicates for each timeframe whether the trend direction.
Информация о релизе
Multi-Timeframe Trend Status Indicator This custom indicator tracks trend direction and Volatility Stop levels across four user-defined timeframes (e.g., 65min, 4h, Daily, Weekly). It uses a smoothed ATR-based logic to detect trend shifts and displays the results in a color-coded table directly on your chart.
🔧 Features:
Trend detection using Volatility Stop logic
Alerts on trend changes per timeframe
Customizable table position and font size
Visual markers for trend shifts
✅ Bug Fix:
The previous issue with dynamic alert messages has been resolved. Alerts now use static strings, ensuring full compatibility with TradingView’s alertcondition() requirements.
Скрипт с открытым кодом
В истинном духе TradingView, создатель этого скрипта сделал его открытым исходным кодом, чтобы трейдеры могли проверить и убедиться в его функциональности. Браво автору! Вы можете использовать его бесплатно, но помните, что перепубликация кода подчиняется нашим Правилам поведения.
Отказ от ответственности
Информация и публикации не предназначены для предоставления и не являются финансовыми, инвестиционными, торговыми или другими видами советов или рекомендаций, предоставленных или одобренных TradingView. Подробнее читайте в Условиях использования.