OPEN-SOURCE SCRIPT
Обновлено Color Changing Moving Average
Hello everybody!
I'm not much of a coder but I do make indicators for myself for fun sometimes and found this one super cool. Hope it helps!
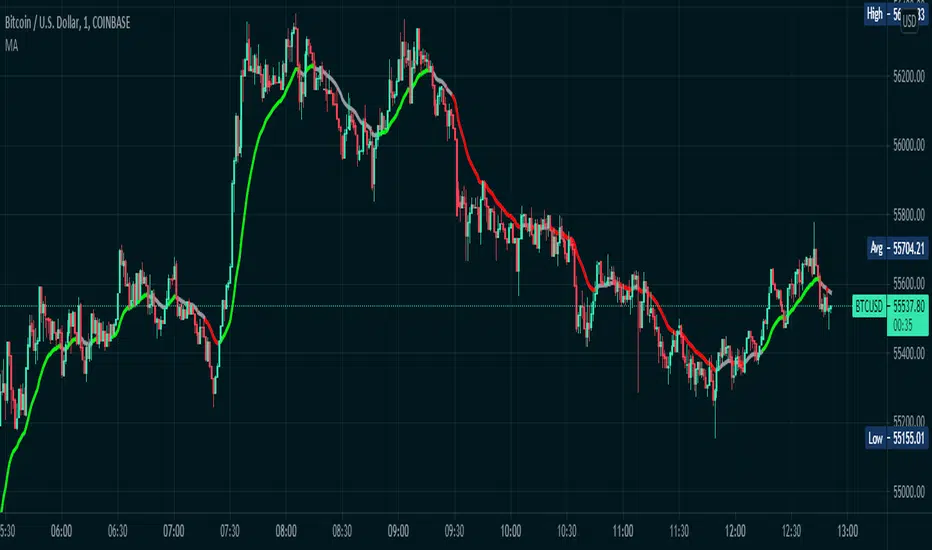
Basically it's a moving average that changes colors based on the trend. How does it do it, you may ask? Simply put, it checks and makes sure that the open and close price is above the moving average, then it checks and sees if the 50-period RSI (length adjustable) is above 50. If both conditions are met, the moving average turns green. Simple as that.
If the price is below the moving average and the RSI is below 50, the moving average turns red.
If the price is above the moving average but the RSI is below 50, the line is grey and I advise to simply waiting for the trend direction to be decided. Likewise, if the price is below the moving average, but the RSI is above 50, the line is also grey.
This is NOT a comprehensive system, and the changing color of the moving average does not indicate a buy or sell signal. It simply indicates that the price is trending. You should use your own entry and exit strategy, such as the MACD, Wave Trend, Schaff Trend Cycle, etc.
As well, I would recommend waiting for confirmation of a trend change when the color changes, since in a range price can cross multiple times before deciding on the right direction.
The slope of the moving average can help too, since in a range the moving average is typically flat.
I would recommend using a fixed risk to reward ratio, to limit emotions. But, this would also help with a trend-following strategy due to the trend filter functionality.
The length of the moving average is adjustable, as well as the RSI period- though I wouldn't recommend selecting an RSI lower than 30 because it will whipsaw more. Disabling the EMA option will give you an SMA that does the same thing as the EMA. You can also disable the RSI filter and simply have a moving average that changes color when the price is above/below- but that's pretty boring, huh?
Anyways, hope this helps, happy trading everybody :)
Информация о релизе
Fixed the offset function so it actually worksИнформация о релизе
Made the colors brighterИнформация о релизе
Added alert conditionИнформация о релизе
Added Alert for when the line turns grey (MA Buy = line is green, MA Sell = line is red, and MA Cancel Buy/Sell = the line has turned grey)Информация о релизе
Changed demonstration tickerСкрипт с открытым кодом
В истинном духе TradingView, создатель этого скрипта сделал его открытым исходным кодом, чтобы трейдеры могли проверить и убедиться в его функциональности. Браво автору! Вы можете использовать его бесплатно, но помните, что перепубликация кода подчиняется нашим Правилам поведения.
Отказ от ответственности
Информация и публикации не предназначены для предоставления и не являются финансовыми, инвестиционными, торговыми или другими видами советов или рекомендаций, предоставленных или одобренных TradingView. Подробнее читайте в Условиях использования.
Скрипт с открытым кодом
В истинном духе TradingView, создатель этого скрипта сделал его открытым исходным кодом, чтобы трейдеры могли проверить и убедиться в его функциональности. Браво автору! Вы можете использовать его бесплатно, но помните, что перепубликация кода подчиняется нашим Правилам поведения.
Отказ от ответственности
Информация и публикации не предназначены для предоставления и не являются финансовыми, инвестиционными, торговыми или другими видами советов или рекомендаций, предоставленных или одобренных TradingView. Подробнее читайте в Условиях использования.