PROTECTED SOURCE SCRIPT
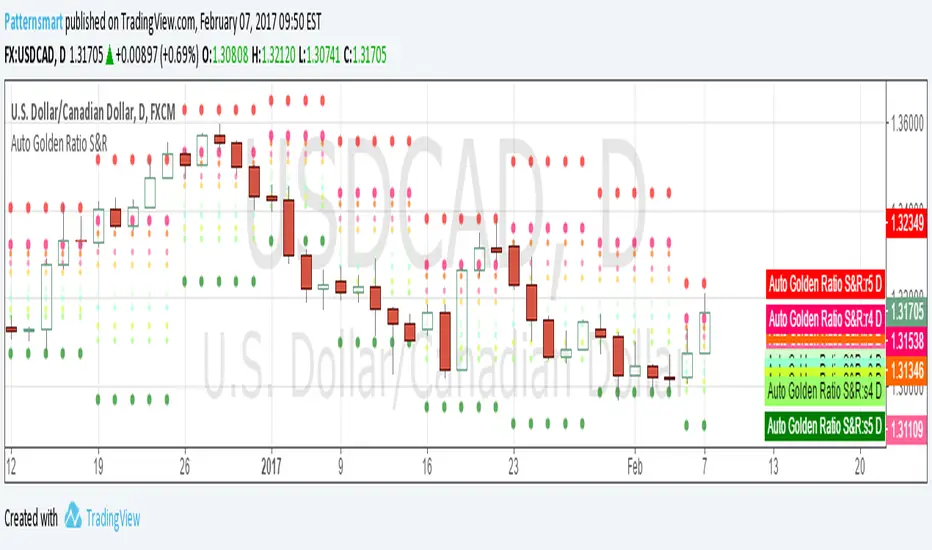
Automatic Golden Ratio Support & Resistance

The golden ratio is also called the golden mean or golden section.
It has been used to analyze the proportions of natural objects as well as man-made systems such as financial markets.
The mathematics of the golden ratio and of the Fibonacci sequence is intimately interconnected. The Fibonacci sequence is: 1, 1, 2, 3, 5, 8, 13, 21, 34, 55, 89, 144, 233, 377, 610, 987, ....
This Golden Ratio indicator automatically plots 5 support levels and 5 resistance levels based on the golden ratio for current timeframe. It shows a possible price range for current session, you can easily identify the major and minor support/resistance levels from the chart.
The levels of support and resistance are formed at the beginning of a new session
This indicator works on all default time frames.
It will never repaint.
There is no parameter. All you need to do is to load it to your chart.
Click the image links to view it in original size.
https://3.bp.blogspot.com/-Zw8QTkYwd-g/VvBe0YJCtVI/AAAAAAAADfE/i4A7lrDreV0iKIIL5_ItV6vM7FIzwPC6A/s1600/1.png
https://2.bp.blogspot.com/-qo0RL9Tp9dc/VvBe1GHX1RI/AAAAAAAADfE/ZqSqMXh2zjsWU9wR-W3dek2B8nSLwro2A/s1600/2.png
https://2.bp.blogspot.com/-uKEQO63Ewts/VvBe1cgHj2I/AAAAAAAADfE/K9ewGQhtQkI8vns2ZHP6yM7EoQgpU2t2g/s1600/3.png
https://3.bp.blogspot.com/-GE6uQcaEud0/VvBe1gLQ1mI/AAAAAAAADfE/iW_Bda4uhLAn1Y2oBybuIwtNoEnyvclXw/s1600/4.png
https://2.bp.blogspot.com/-lDjpfnzB_7s/VvBe1xiI7tI/AAAAAAAADfE/v-XbGiN2aYw-MxfmdbuKVp_CRhoEyivxQ/s1600/5.png
https://2.bp.blogspot.com/-aHNBhx0P5Uc/VvBe2z1cMMI/AAAAAAAADfE/3_zxNtctEewoYsSwpOm3YUtp_h2H5LshQ/s1600/8.png
https://1.bp.blogspot.com/-saKT5VRAeOI/VvBe3BXuHFI/AAAAAAAADfE/btBeiwKdi_sVRkwcv-RkEgq4daljIWVpg/s1600/0.png
////////////////////////////////////////////////////////////
// Technical Analysis & Research Patternsmart
//
// Custom indicators, Strategies, SCAN, Screener, Backtesting, Converting service for:
// Tradingview, NinjaTrader, Thinkorswim, MetaTrader, MetaStock, Multicharts, Prorealtime, etc.
////////////////////////////////////////////////////////////
Скрипт с защищённым кодом
Этот скрипт опубликован с закрытым исходным кодом. Однако вы можете использовать его свободно и без каких-либо ограничений — читайте подробнее здесь.
Отказ от ответственности
Все виды контента, которые вы можете увидеть на TradingView, не являются финансовыми, инвестиционными, торговыми или любыми другими рекомендациями. Мы не предоставляем советы по покупке и продаже активов. Подробнее — в Условиях использования TradingView.