CycleVISION [BitAura]
This Pine Script® indicator combines a long-term trend-following strategy with a cycle valuation Z-score analysis to generate a Trend Probability Indicator (TPI). The TPI aggregates signals from multiple trend and on-chain metrics to identify optimal entry and exit points for a single asset, with USD as a cash position. The system also calculates a comprehensive Z-score based on performance and valuation metrics to assess market cycles, aiming to enhance risk-adjusted returns for long-term investors.
Logic and Core Concepts
The 𝐂ycle𝑽𝑰𝑺𝑰𝑶𝑵 System uses two primary components to guide investing decisions:
1. Trend Probability Indicator (TPI)
- Mechanism: Aggregates five proprietary, universal, trend signals and three on-chain metrics into a composite TPI score, normalized between -1 and 1.
- Thresholds: Enters a long position when the TPI score exceeds a user-defined long threshold (default: 0.0) and exits to cash when it falls below a short threshold (default: -0.5).
- Execution: Trades are executed only on confirmed bars within a user-specified backtest date range, ensuring robust signal reliability.
2. Cycle Valuation Z-Score
- Mechanism: Computes an average Z-score from six metrics: Sharpe Ratio, Sortino Ratio, Omega Ratio, Weekly RSI, Crosby Ratio, and Price Z-Score, using a 1200-bar lookback period.
- Purpose: Identifies overvalued or undervalued market conditions to complement TPI signals, with thresholds at ±1.8 for extreme valuations.
[8]Visualization: Displays the average Z-score and individual components, with gradient-based bar coloring to reflect valuation strength.
Features
- Dynamic Trend Signals: Combines trend and on-chain data into a single TPI score for clear long/cash decisions.
- Comprehensive Valuation: Calculates Z-scores for multiple performance and price metrics to assess market cycles.
- Customizable Inputs: Allows users to adjust TPI thresholds, backtest date ranges, and valuation metrics visibility.
- Visual Outputs:
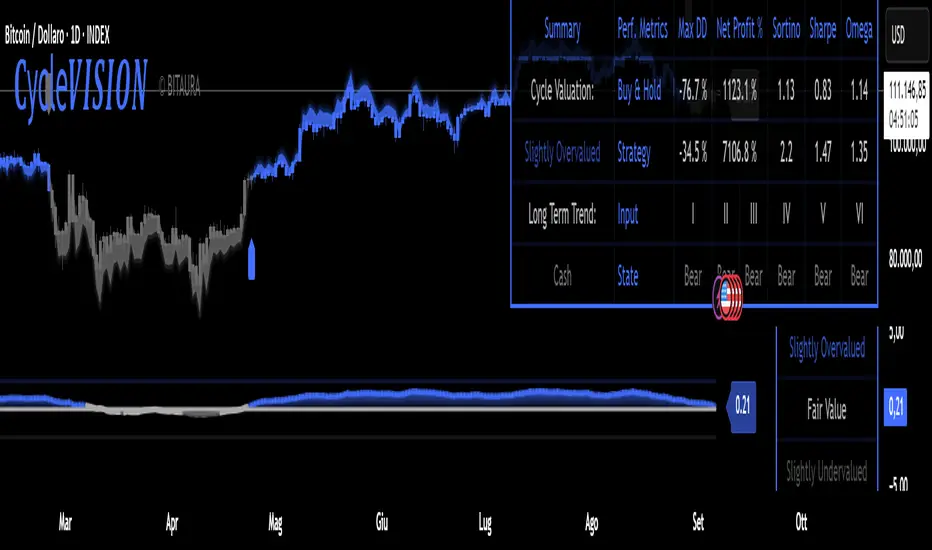
Valuation Table: Displays TPI score, Z-scores, and performance metrics (Sharpe, Sortino, Omega, Max Drawdown, Net Profit) in a configurable table (Lite, Medium, Full).
Equity Curve: Plots the system’s equity curve compared to buy-and-hold performance.
Price and TPI Plot: Overlays TPI-adjusted price bands with glow effects and filled gaps for trend visualization on the price chart.
Valuation Coloring: Applies backgrounds based on Z-score ranges (e.g., strong buy above 1.8, strong sell below -1.8). - Configurable Alerts: Notifies users of TPI signal changes (Long to Cash or Cash to Long) with detailed messages.
- Color Presets: Offers five color themes (e.g., Arctic Blast, Fire vs. Ice) or custom color options for long/short signals.
- Pine Script v6: Leverages matrices, tables, and gradient coloring for enhanced usability.
How to Use- Add to Chart: Apply the indicator to any chart (the chart’s ticker is used for calculations, e.g.,
 BTCUSD).
 - Configure Settings: Adjust TPI thresholds, backtest start date (default: 01 Feb 2018), and valuation metrics visibility in the Inputs menu.
- Select Color Theme: Choose a preset color mode (e.g., Arctic Blast) or enable custom colors in the Colors group.
- Monitor Outputs: Check the Valuation Table for TPI and Z-score data, and view the Price and TPI Plot for trend signals.
- Analyze Performance: Enable the equity curve and performance metrics in the Backtesting Options group to compare results.
- Set Alerts: Right-click a plot, select "Add alert," and choose "Trend Change: Long to Cash" or "Trend Change: Cash to Long" for notifications.
Notes- The script is closed-source.
- Use a standard price series (not Heikin Ashi or other non-standard types) for accurate results.
- The script avoids lookahead bias by using barmerge.lookahead_off in request.security() calls.
- A minimum 1200-bar lookback is mandatory for Z-score calculations to avoid errors, with warnings displayed if insufficient price history is available.
- The BitAura watermark can be toggled in the Table Settings group.
- Add to Chart: Apply the indicator to any chart (the chart’s ticker is used for calculations, e.g.,
Скрипт с ограниченным доступом
Доступ к этому скрипту имеют только пользователи, одобренные автором. Вам необходимо запросить и получить разрешение на его использование. Обычно оно предоставляется после оплаты. Для получения подробной информации следуйте инструкциям автора ниже или свяжитесь напрямую с BitAura.
TradingView НЕ рекомендует оплачивать или использовать скрипт, если вы полностью не доверяете его автору и не понимаете, как он работает. Вы также можете найти бесплатные, открытые альтернативы в наших скриптах сообщества.
Инструкции от автора
Отказ от ответственности
Скрипт с ограниченным доступом
Доступ к этому скрипту имеют только пользователи, одобренные автором. Вам необходимо запросить и получить разрешение на его использование. Обычно оно предоставляется после оплаты. Для получения подробной информации следуйте инструкциям автора ниже или свяжитесь напрямую с BitAura.
TradingView НЕ рекомендует оплачивать или использовать скрипт, если вы полностью не доверяете его автору и не понимаете, как он работает. Вы также можете найти бесплатные, открытые альтернативы в наших скриптах сообщества.