OPEN-SOURCE SCRIPT
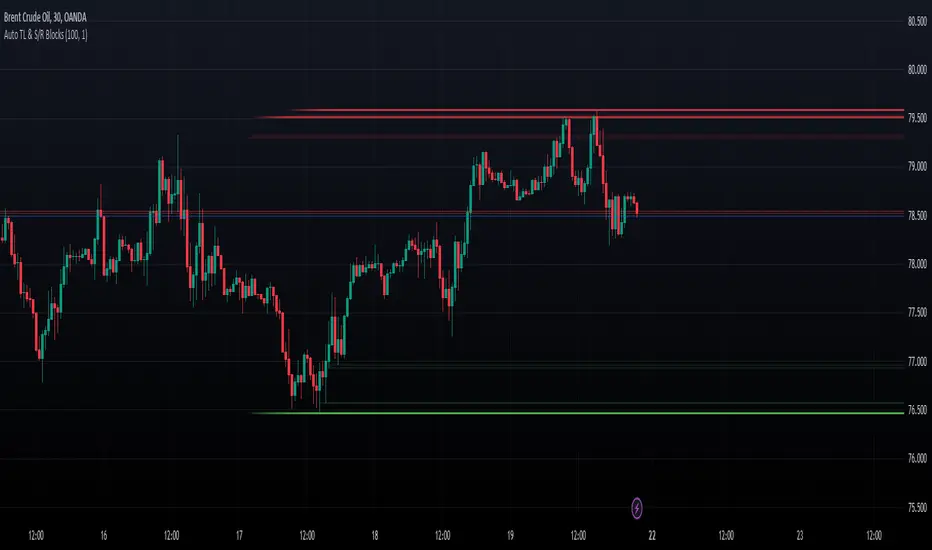
Dynamic Auto Trendline and S/R Blocks

Auto TL & S/R Blocks by Nostalgic_92
This powerful TradingView indicator automatically identifies trendlines and support/resistance levels with dynamic transparency blocks, helping traders make informed decisions. Easily customizable, it offers adjustable parameters for lookback periods and transparency, allowing you to adapt it to your trading style.
Key Features:
Lookback Period for Extremes: The lookback period for identifying highs and lows is adjustable, allowing you to fine-tune the indicator to suit your trading strategy.
Maximum Transparency: Set the maximum transparency level to control the visibility of dynamic blocks, ensuring they adapt to market volatility.
Trend Block Color: Choose your preferred color for trendline blocks to visually highlight trend direction.
Support/Resistance Block Color: Customize the color for support and resistance blocks, making them easily distinguishable on your chart.
How it Works:
This indicator calculates the highest high and lowest low over the specified lookback period. It then draws dynamic blocks on your chart with changing transparency levels, depending on the proximity of the current price to these extremes. This visual representation helps you identify trend changes and key support/resistance levels at a glance.
Usage:
Use it in conjunction with your existing trading strategy to confirm trends and support/resistance levels.
Adjust the input parameters to match your preferred trading style and time frame.
Enhance your trading experience with the Auto Trendlines and Support/Resistance with Dynamic Blocks indicator. It's a valuable tool for traders seeking an edge in the market.
Disclaimer: This indicator is intended for educational and informational purposes only. Always conduct your own research and analysis before making trading decisions.
Скрипт с открытым кодом
В истинном духе TradingView, создатель этого скрипта сделал его открытым исходным кодом, чтобы трейдеры могли проверить и убедиться в его функциональности. Браво автору! Вы можете использовать его бесплатно, но помните, что перепубликация кода подчиняется нашим Правилам поведения.
Отказ от ответственности
Информация и публикации не предназначены для предоставления и не являются финансовыми, инвестиционными, торговыми или другими видами советов или рекомендаций, предоставленных или одобренных TradingView. Подробнее читайте в Условиях использования.