OPEN-SOURCE SCRIPT
Ratio MA100/MA200
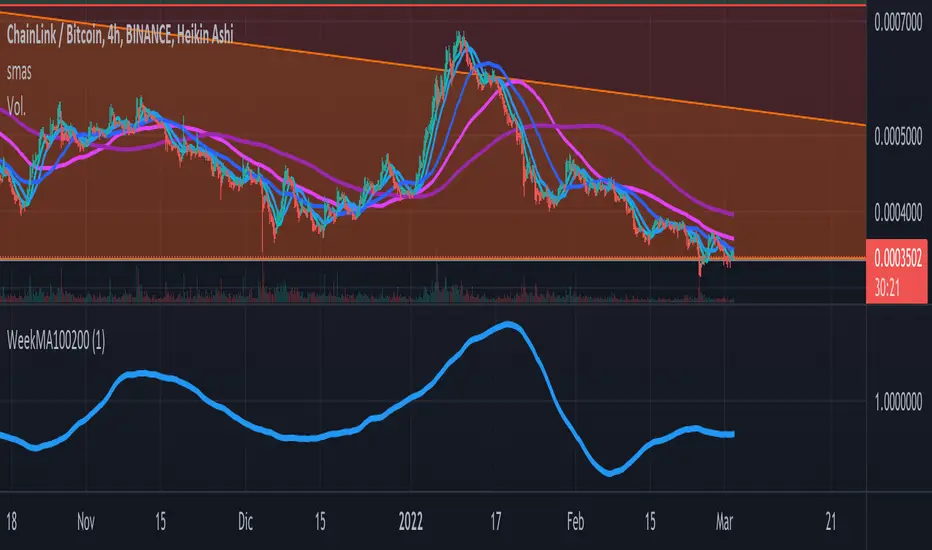
It plots the ratio between the MA of 100 periods and the MA of 200 periods. It can be used to observe volatility and market peaks and lows. The change in concavity of the function indicates the peak or the low rather than the peaks and lows of the plot itself.
Скрипт с открытым кодом
В истинном духе TradingView, создатель этого скрипта сделал его открытым исходным кодом, чтобы трейдеры могли проверить и убедиться в его функциональности. Браво автору! Вы можете использовать его бесплатно, но помните, что перепубликация кода подчиняется нашим Правилам поведения.
Отказ от ответственности
Информация и публикации не предназначены для предоставления и не являются финансовыми, инвестиционными, торговыми или другими видами советов или рекомендаций, предоставленных или одобренных TradingView. Подробнее читайте в Условиях использования.