OPEN-SOURCE SCRIPT
Chop Zones

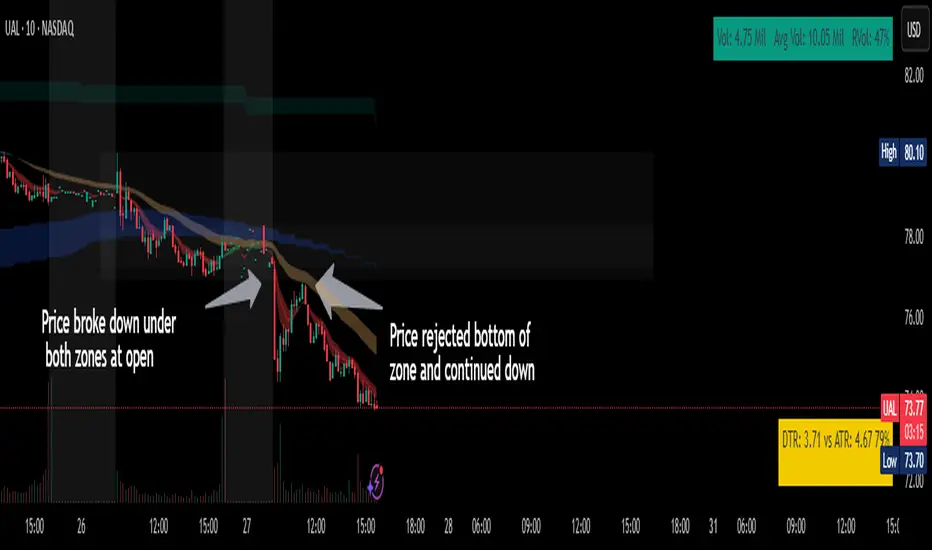
This indicator plots two "zones" in the form of shaded boxes, one between PMH and PML and one between PDH and PDL, the area that is shaded more has the highest probability of price action to be "choppy", the lesser shaded area has less probability for "choppy" action whilst outside the shaded areas there is high probability of a trend.
This indicator can be used to determine one of the three types of day:
Chop day
Bullish trend day
Bearish trend day
Chop day example today on SPY
SPY

Bullish trend day example on DLTR
DLTR

Bearish trend day example on UAL
UAL

This indicator can be used to determine one of the three types of day:
Chop day
Bullish trend day
Bearish trend day
Chop day example today on
Bullish trend day example on
Bearish trend day example on
Скрипт с открытым кодом
В истинном духе TradingView, создатель этого скрипта сделал его открытым исходным кодом, чтобы трейдеры могли проверить и убедиться в его функциональности. Браво автору! Вы можете использовать его бесплатно, но помните, что перепубликация кода подчиняется нашим Правилам поведения.
Отказ от ответственности
Информация и публикации не предназначены для предоставления и не являются финансовыми, инвестиционными, торговыми или другими видами советов или рекомендаций, предоставленных или одобренных TradingView. Подробнее читайте в Условиях использования.