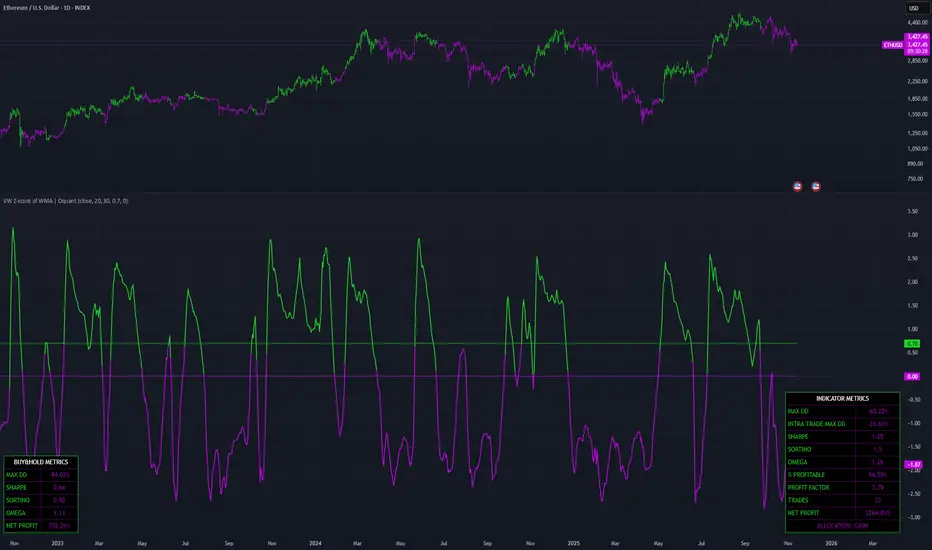
VW Z-score of WMA | Oquant
The VW Z-score of WMA is an indicator designed to identify potential trading opportunities by analyzing price momentum through a volume-weighted lens. It combines a weighted moving average (WMA) with a customized Z-score metric that incorporates volume data, providing signals for long and short positions based on user-defined thresholds. Beyond signaling, the indicator offers comprehensive performance metrics, including risk-adjusted returns like Sharpe and Sortino ratios, drawdown statistics, and profitability measures(remember past performance doesn’t guarantee future results). It also visualizes an equity curve and displays results in intuitive tables for quick assessment. This tool is ideal for traders seeking to incorporate their strategies with volume-informed deviation analysis, while comparing indicator performance against a simple buy-and-hold approach(remember past performance doesn’t guarantee future results).
Key Factors/Components
Core Signal Generation: Utilizes a WMA as the base, incorporated with a volume-weighted Z-score to gauge volume weighted deviations from the mean, triggering long or short signals when thresholds are crossed.
Trade Management Options: Allows toggling of long and short trades, defaulting to cash positions if disabled, ensuring flexibility in bullish, or bearish markets.
Performance Metrics: Calculates metrics such as Maximum Drawdown (including intra-trade), Sharpe Ratio, Sortino Ratio, Omega Ratio, Percent Profitable, Profit Factor, and Net Profit.
Visualization Tools: Plots the volume weighted Z-score of WMA with color-coded signals, optional equity curve, and bar coloring for easy interpretation. Includes two tables: one for indicator metrics and another for buy-and-hold benchmarks.
Alert Conditions: Built-in alerts for bullish and bearish crossovers to notify users of potential entry/exit points.
Backtesting Elements: Simulates strategy equity from a user-defined start date, incorporating rate of change for return calculations.
How It Works
The indicator starts by smoothing the input source (default: close price) with a WMA to capture trend direction. It then applies a volume-weighted Z-score to this WMA, measuring how far the current value deviates from its recent volume-adjusted average, normalized by volume weighted standard deviation. Signals are generated when this Z-score exceeds an upper threshold (indicating potential longs) or falls below a lower threshold (for potential shorts). The system tracks position allocation (long, short, or cash) and computes an equity curve based on daily returns, adjusting for enabled trade directions. Performance metrics are derived from this equity curve, focusing on risk-reward balance, downside protection, and overall efficiency(remember past performance doesn’t guarantee future results). Tables provide a side-by-side comparison with asset buy-and-hold stats, helping users evaluate the indicator against simple buy&hold strategy(remember past performance doesn’t guarantee future results).
For Who Is Best/Recommended Use Cases
This indicator is best suited for swing traders, position traders, and day traders—particularly those who follow trends and integrate volume and statistical deviation into their strategies. It's recommended for:
Trend-Following Traders: Ideal for capturing momentum shifts in trending markets, such as entering longs during upward deviations or shorts during downside deviations.
Swing Traders: Swing traders can use the volume weighted Z-score signals and thresholds for entries and exits during trending environments.
Position Traders: Those maintaining trades for longer periods, using the indicator's trend confirmation and performance metrics to align with potential market directions.
Day Traders: Those operating on intraday timeframes, using alerts for potential quick momentum plays while monitoring performance metrics to manage risk during sessions.
Remember past performance doesn’t guarantee future results!
Settings and Default Settings
Start Date: Defines the backtesting start period (default: January 1, 2018).
Source: Input data for calculations (default: close price).
WMA Length: Period for the weighted moving average (default: 20).
Volume Weighted Z-score Length: Lookback for volume weighted Z-score computation (default: 30).
Upper Threshold: Level for long signals (default: 0.7).
Lower Threshold: Level for short signals (default: 0.0).
Allow Long Trades: Enables/disables longs (default: true).
Allow Shorts: Enables/disables shorts (default: false).
Show Indicator Metrics Table: Toggles the performance table (default: true).
Show Buy&Hold Table: Toggles the benchmark table (default: true).
Plot Equity Curve: Displays the strategy's equity line (default: false).
These defaults provide a balanced starting point for momentum trading; adjust thresholds for sensitivity and lengths for smoother signals.
Conclusion
The VW Z-score of WMA is a tool that blends stats with practical trading insights, helping users incorporate data-driven elements into their decisions while being mindful of potential drawdowns. By integrating volume-weighted analysis with metrics, it aids in evaluating strategy viability against passive investing.
Remember past performance doesn’t guarantee future results!
⚠️ Disclaimer: This indicator is intended for educational and informational purposes only. Trading/investing involves risk, and past performance does not guarantee future results. Always test and evaluate indicators/strategies before applying them in live markets. Use at your own risk.
Скрипт с ограниченным доступом
Only users approved by the author can access this script. You'll need to request and get permission to use it. This is typically granted after payment. For more details, follow the author's instructions below or contact oquant directly.
TradingView does NOT recommend paying for or using a script unless you fully trust its author and understand how it works. You may also find free, open-source alternatives in our community scripts.
Инструкции от автора
oquantsystems.com
Отказ от ответственности
Скрипт с ограниченным доступом
Only users approved by the author can access this script. You'll need to request and get permission to use it. This is typically granted after payment. For more details, follow the author's instructions below or contact oquant directly.
TradingView does NOT recommend paying for or using a script unless you fully trust its author and understand how it works. You may also find free, open-source alternatives in our community scripts.
Инструкции от автора
oquantsystems.com