OPEN-SOURCE SCRIPT
Обновлено Nexus Blast Trading Strategy [Kaspricci]
Nexus Blast Trading Strategy - Kaspricci
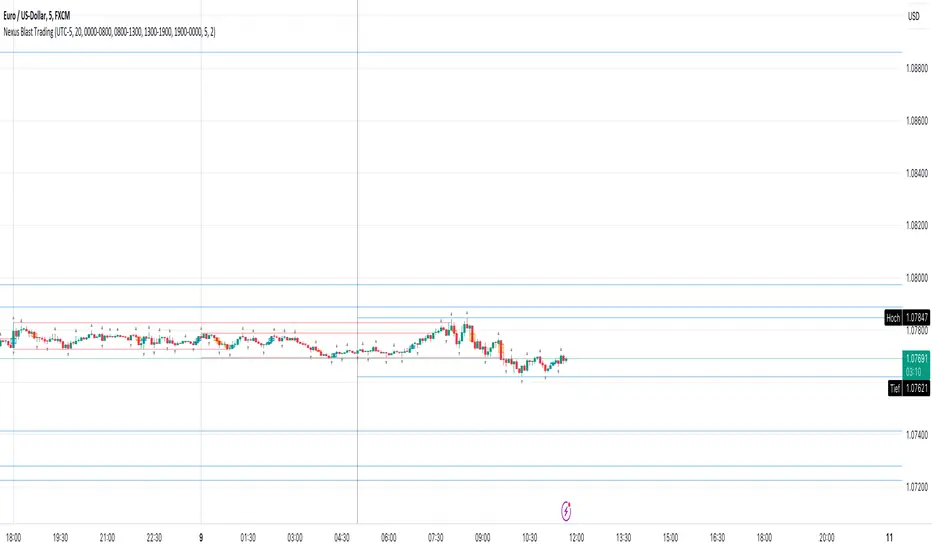
This indicator shows the different sessions during the day (London session, New York AM session, New York PM session and Asian session) by adding vertical lines and draws horizontal lines for the high and low during each session. Furthermore those lines turn red once the price has taken this high or low. Blue lines indicate liquidity not yet taken.
On top the indicator draws boxes of different color to indicate bullish and bearish Fair Value Gaps (FVG).
Happy to receive your feedback. Please leave a comment for bugs as well as ideas for improvement.
General Settings
Sessions
FVG Settings
This script is for educational purposes only! It is not meant to be a financial advice.
PS: The former strategy script was removed by TV, as it would violate several rules according to them.
This indicator shows the different sessions during the day (London session, New York AM session, New York PM session and Asian session) by adding vertical lines and draws horizontal lines for the high and low during each session. Furthermore those lines turn red once the price has taken this high or low. Blue lines indicate liquidity not yet taken.
On top the indicator draws boxes of different color to indicate bullish and bearish Fair Value Gaps (FVG).
Happy to receive your feedback. Please leave a comment for bugs as well as ideas for improvement.
General Settings
- Time Zone - used for marking sessions and end of day.
Sessions
- Sessions - start and end time for each session based on set time zone
- Number of Days back - for how many days in the past the startegy will draw strategy highs and lows. Theres is a maximum of 50 days defined.
FVG Settings
- Threshold in Ticks - you can hide very small FVGs by increasing this threshold
- FVG Colors - colors used for the bearish and bullish FVG box
This script is for educational purposes only! It is not meant to be a financial advice.
PS: The former strategy script was removed by TV, as it would violate several rules according to them.
Информация о релизе
New Feature added:- Indicator supports now alert conditions for sell & buy side liquidity been taken.
Информация о релизе
Small adjustment. Now you can also chaneg the color and transparency of the new session and new day line. Информация о релизе
New version with some smaller improvements / changes:- I had to change a bit the internal code of the indicator. So now you can change the number of sessions in the past shown on the chart. The maximum is 250 sessions. Mainly driven by the fact that there is a maximum number of 500 lines on a chart which TV can handle.
- You can change the color of the session high / low lines and turn on/off that they will extend to the right. Taken lines will only extend to the bar, which took them.
- I also had to change the alert part. So you now simply create an alert for the indicator and it will handle both types of alerts (sell and buy side) at the same time.
As usual please leave a comment when you like it or see some opportunity to further improve it.
Информация о релизе
New feature to show Fractals added. You can change the numbers of bars left/right to identify a fractal. Default is set to 2. You can also change color of the symbol for a fractal high/low.Скрипт с открытым кодом
В истинном духе TradingView, создатель этого скрипта сделал его открытым исходным кодом, чтобы трейдеры могли проверить и убедиться в его функциональности. Браво автору! Вы можете использовать его бесплатно, но помните, что перепубликация кода подчиняется нашим Правилам поведения.
Отказ от ответственности
Информация и публикации не предназначены для предоставления и не являются финансовыми, инвестиционными, торговыми или другими видами советов или рекомендаций, предоставленных или одобренных TradingView. Подробнее читайте в Условиях использования.
Скрипт с открытым кодом
В истинном духе TradingView, создатель этого скрипта сделал его открытым исходным кодом, чтобы трейдеры могли проверить и убедиться в его функциональности. Браво автору! Вы можете использовать его бесплатно, но помните, что перепубликация кода подчиняется нашим Правилам поведения.
Отказ от ответственности
Информация и публикации не предназначены для предоставления и не являются финансовыми, инвестиционными, торговыми или другими видами советов или рекомендаций, предоставленных или одобренных TradingView. Подробнее читайте в Условиях использования.