OPEN-SOURCE SCRIPT
Stoch + RSI Oscillator @shrilss
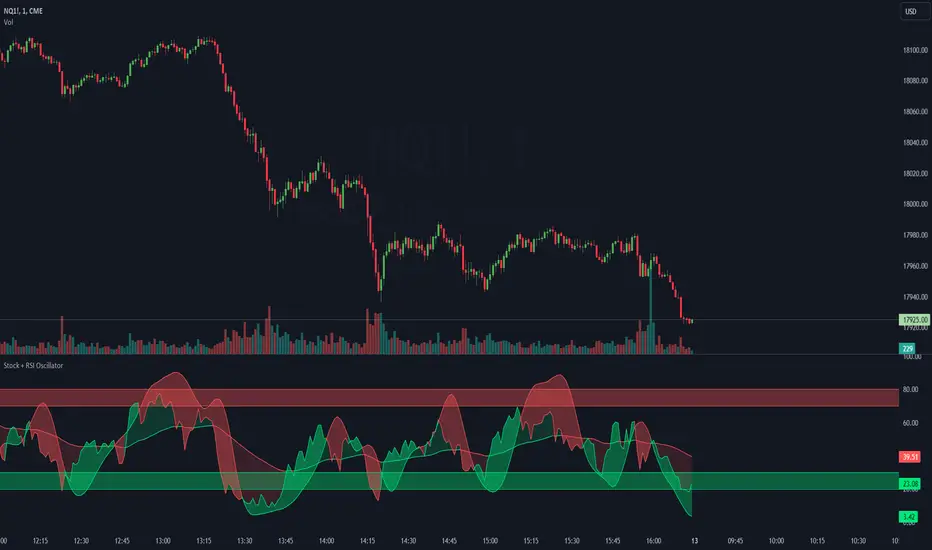
This script combines two powerful indicators, the Stochastic Oscillator and the Relative Strength Index (RSI), to offer traders a comprehensive view of market dynamics.
The Stochastic Oscillator, known for its effectiveness in identifying overbought and oversold conditions, is enhanced here with a smoothing mechanism to provide clearer signals. The script calculates the %K and %D lines of the Stochastic Oscillator, then applies a smoothing factor to %K, resulting in a smoother representation of price momentum.
Simultaneously, the RSI component offers insights into the strength of price movements. By comparing the average gains and losses over a specified period, it provides a measure of bullish and bearish sentiment within the market.
This script's innovation lies in its integration of these two indicators. The Stochastic Oscillator's smoothed %K line and the RSI are compared to dynamic thresholds, enabling traders to identify potential trend reversals and confirmations more effectively. When the RSI crosses above or below the Stochastic %D line, it can signal potential shifts in market momentum.
Скрипт с открытым кодом
В истинном духе TradingView, создатель этого скрипта сделал его открытым исходным кодом, чтобы трейдеры могли проверить и убедиться в его функциональности. Браво автору! Вы можете использовать его бесплатно, но помните, что перепубликация кода подчиняется нашим Правилам поведения.
Отказ от ответственности
Информация и публикации не предназначены для предоставления и не являются финансовыми, инвестиционными, торговыми или другими видами советов или рекомендаций, предоставленных или одобренных TradingView. Подробнее читайте в Условиях использования.