OPEN-SOURCE SCRIPT
Turnover
// ========================================
// TURNOVER INDICATOR (成交额指标)
// ========================================
//
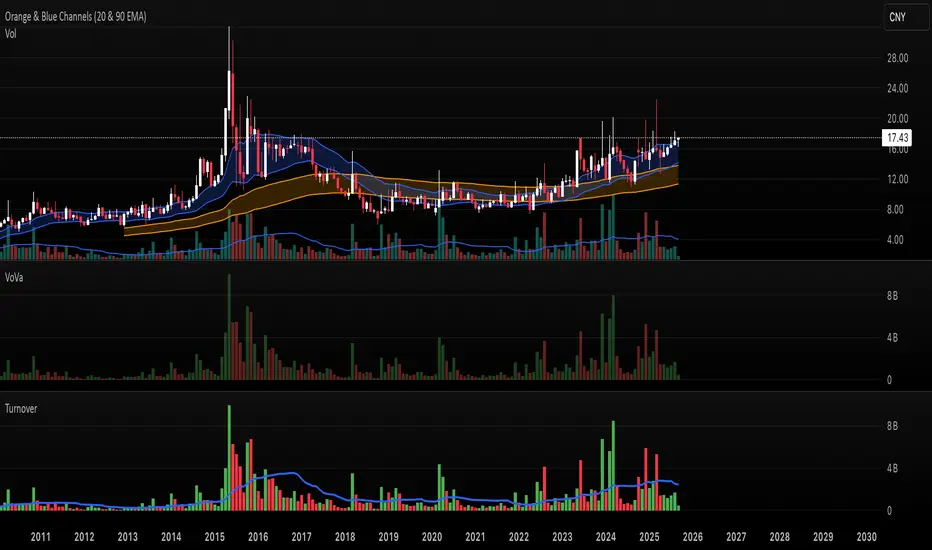
// This indicator calculates and displays the turnover (trading value) for each bar,
// which represents the total monetary value of shares traded during that period.
// Turnover = Volume × Price
//
// KEY FEATURES:
// • Multiple price basis options: VWAP (recommended for intraday) or HLC3 average
// • Visual representation with colored columns (red/green for down/up bars)
// • Moving average overlay to smooth turnover trends
// • Rolling sum calculation for cumulative turnover over specified periods
// • Fully customizable parameters for different trading strategies
//
// USE CASES:
// • Identify periods of high/low market activity and liquidity
// • Analyze institutional money flow and market participation
// • Spot potential breakout or reversal points based on turnover spikes
// • Compare relative trading interest across different timeframes
// • Monitor market strength during trend formations
//
// PARAMETERS:
// • Price Basis: Choose between VWAP (intraday focus) or HLC3 (daily+ timeframes)
// • Visual Options: Toggle MA, rolling sum, and color coding
// • Timeframe Flexibility: Adjust MA and sum periods for your analysis needs
//
// ========================================
// TURNOVER INDICATOR (成交额指标)
// ========================================
//
// This indicator calculates and displays the turnover (trading value) for each bar,
// which represents the total monetary value of shares traded during that period.
// Turnover = Volume × Price
//
// KEY FEATURES:
// • Multiple price basis options: VWAP (recommended for intraday) or HLC3 average
// • Visual representation with colored columns (red/green for down/up bars)
// • Moving average overlay to smooth turnover trends
// • Rolling sum calculation for cumulative turnover over specified periods
// • Fully customizable parameters for different trading strategies
//
// USE CASES:
// • Identify periods of high/low market activity and liquidity
// • Analyze institutional money flow and market participation
// • Spot potential breakout or reversal points based on turnover spikes
// • Compare relative trading interest across different timeframes
// • Monitor market strength during trend formations
//
// PARAMETERS:
// • Price Basis: Choose between VWAP (intraday focus) or HLC3 (daily+ timeframes)
// • Visual Options: Toggle MA, rolling sum, and color coding
// • Timeframe Flexibility: Adjust MA and sum periods for your analysis needs
//
// ========================================
Скрипт с открытым кодом
В истинном духе TradingView, создатель этого скрипта сделал его открытым исходным кодом, чтобы трейдеры могли проверить и убедиться в его функциональности. Браво автору! Вы можете использовать его бесплатно, но помните, что перепубликация кода подчиняется нашим Правилам поведения.
Отказ от ответственности
Информация и публикации не предназначены для предоставления и не являются финансовыми, инвестиционными, торговыми или другими видами советов или рекомендаций, предоставленных или одобренных TradingView. Подробнее читайте в Условиях использования.