OPEN-SOURCE SCRIPT
Range over Volume
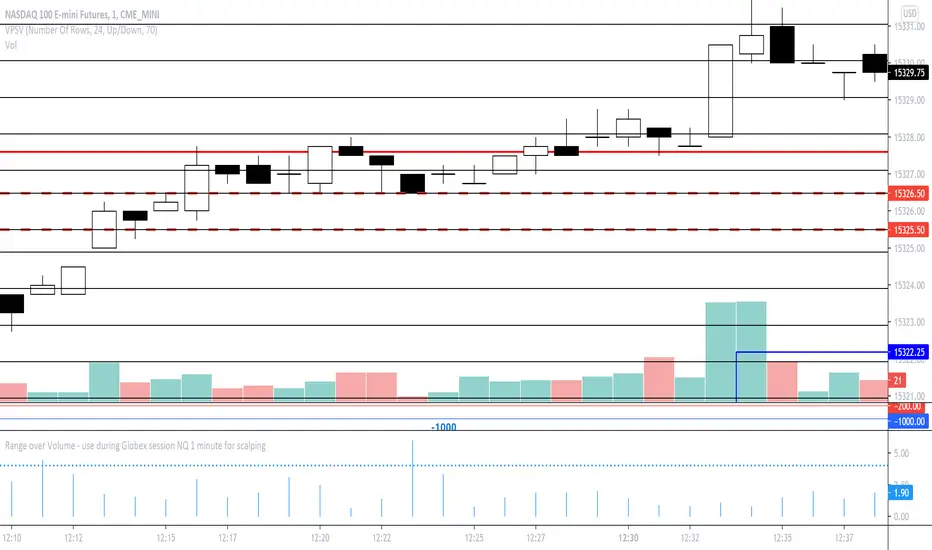
This is a scalping aid for NQ in the 1 minute time range for the Globex session.
Mathematically, the plot is range in ticks divided by 0.1*volume
This returns a histogram plot for RoV (range over volume)
The idea is that candles that ascribe a larger range with minimal volume does because there is unilateral aggression from the buy side, or sell side, and the subsequent behavioural outcome of this will either be an extension of that aggression unilaterally, or commonly, a counter to that aggression!
Wait for a candle to close with the RoV above 4.00. For that candle which formed the RoV above 4.00, plot the highs and lows of that candle and draw a 1.618x and -0.618x Fibonacci extension across it.
Enter short on the -0.618x and take profits at the -1.618x. Use the low of the ROV > 4 candle as a protective stop
Enter long on the 1.618 and take profits at 2.618. Use the high of the ROV > 4 candle as a protective stop
Скрипт с открытым кодом
В истинном духе TradingView, создатель этого скрипта сделал его открытым исходным кодом, чтобы трейдеры могли проверить и убедиться в его функциональности. Браво автору! Вы можете использовать его бесплатно, но помните, что перепубликация кода подчиняется нашим Правилам поведения.
Отказ от ответственности
Информация и публикации не предназначены для предоставления и не являются финансовыми, инвестиционными, торговыми или другими видами советов или рекомендаций, предоставленных или одобренных TradingView. Подробнее читайте в Условиях использования.