OPEN-SOURCE SCRIPT
SOPR with Z-Score Table
📊 Glassnode SOPR with Dynamic Z-Score Table
ℹ️ Powered by Glassnode On-Chain Metrics
📈 Description:
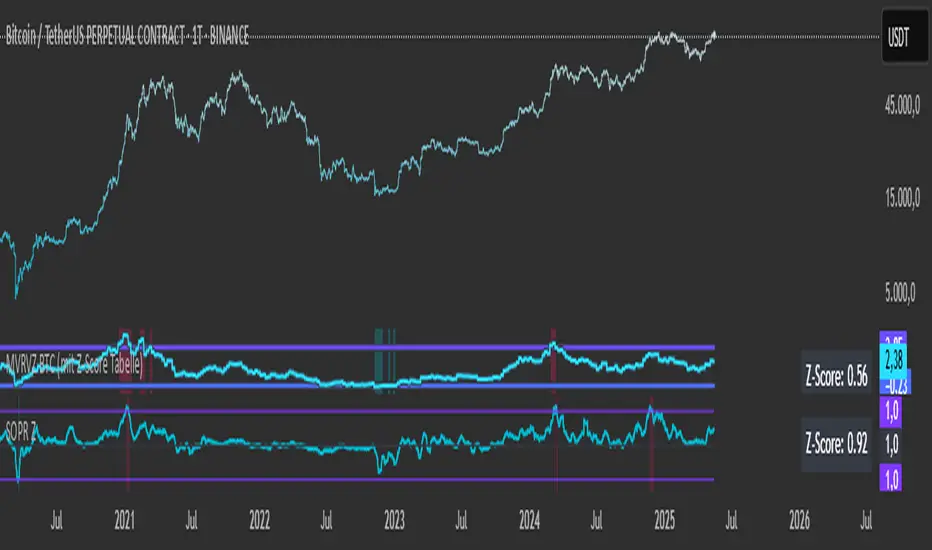
This indicator visualizes the Spent Output Profit Ratio (SOPR) for major cryptocurrencies — Bitcoin, Ethereum, and Litecoin — along with a dynamically normalized Z-Score. SOPR is a key on-chain metric that reflects whether coins moved on-chain are being sold at a profit or a loss.
🔍 SOPR is calculated using Glassnode’s entity-adjusted SOPR feed, and a custom SMA is applied to smooth the signal. The normalized Z-Score helps identify market sentiment extremes by scaling SOPR relative to its historical context.
📊 Features:
Selectable cryptocurrency: Bitcoin, Ethereum, or Litecoin
SOPR smoothed by user-defined SMA (default: 10 periods)
Upper & lower bounds (±4%) for SOPR, shown as red/green lines
Background highlighting when SOPR moves outside normal range
Normalized Z-Score scaled between –2 and +2
Live Z-Score display in a compact top-right table
🧮 Calculations:
SOPR data is sourced daily from Glassnode:
Bitcoin: XTVCBTC_SOPR
Ethereum: XTVCETH_SOPR
Litecoin: XTVCLTC_SOPR
Z-Score is calculated as:
SMA of SOPR over zscore_length periods
Standard deviation of SOPR
Z-Score = (SOPR – mean) / standard deviation
Z-Score is clamped between –2 and +2 for visual consistency
🎯 Interpretation:
SOPR > 1 implies coins are sold in profit
SOPR < 1 suggests coins are sold at a loss
When SOPR is significantly above or below its recent range (e.g., +4% or –4%), it may signal overheating or capitulation
The Z-Score contextualizes how extreme the current SOPR is relative to history
📌 Notes:
Best viewed on daily charts
Works across selected assets (BTC, ETH, LTC)
ℹ️ Powered by Glassnode On-Chain Metrics
📈 Description:
This indicator visualizes the Spent Output Profit Ratio (SOPR) for major cryptocurrencies — Bitcoin, Ethereum, and Litecoin — along with a dynamically normalized Z-Score. SOPR is a key on-chain metric that reflects whether coins moved on-chain are being sold at a profit or a loss.
🔍 SOPR is calculated using Glassnode’s entity-adjusted SOPR feed, and a custom SMA is applied to smooth the signal. The normalized Z-Score helps identify market sentiment extremes by scaling SOPR relative to its historical context.
📊 Features:
Selectable cryptocurrency: Bitcoin, Ethereum, or Litecoin
SOPR smoothed by user-defined SMA (default: 10 periods)
Upper & lower bounds (±4%) for SOPR, shown as red/green lines
Background highlighting when SOPR moves outside normal range
Normalized Z-Score scaled between –2 and +2
Live Z-Score display in a compact top-right table
🧮 Calculations:
SOPR data is sourced daily from Glassnode:
Bitcoin: XTVCBTC_SOPR
Ethereum: XTVCETH_SOPR
Litecoin: XTVCLTC_SOPR
Z-Score is calculated as:
SMA of SOPR over zscore_length periods
Standard deviation of SOPR
Z-Score = (SOPR – mean) / standard deviation
Z-Score is clamped between –2 and +2 for visual consistency
🎯 Interpretation:
SOPR > 1 implies coins are sold in profit
SOPR < 1 suggests coins are sold at a loss
When SOPR is significantly above or below its recent range (e.g., +4% or –4%), it may signal overheating or capitulation
The Z-Score contextualizes how extreme the current SOPR is relative to history
📌 Notes:
Best viewed on daily charts
Works across selected assets (BTC, ETH, LTC)
Скрипт с открытым кодом
В истинном духе TradingView, создатель этого скрипта сделал его открытым исходным кодом, чтобы трейдеры могли проверить и убедиться в его функциональности. Браво автору! Вы можете использовать его бесплатно, но помните, что перепубликация кода подчиняется нашим Правилам поведения.
Отказ от ответственности
Информация и публикации не предназначены для предоставления и не являются финансовыми, инвестиционными, торговыми или другими видами советов или рекомендаций, предоставленных или одобренных TradingView. Подробнее читайте в Условиях использования.