OPEN-SOURCE SCRIPT
Обновлено Volume Support & Resistance multi timeframe [LM]
Hello guys,
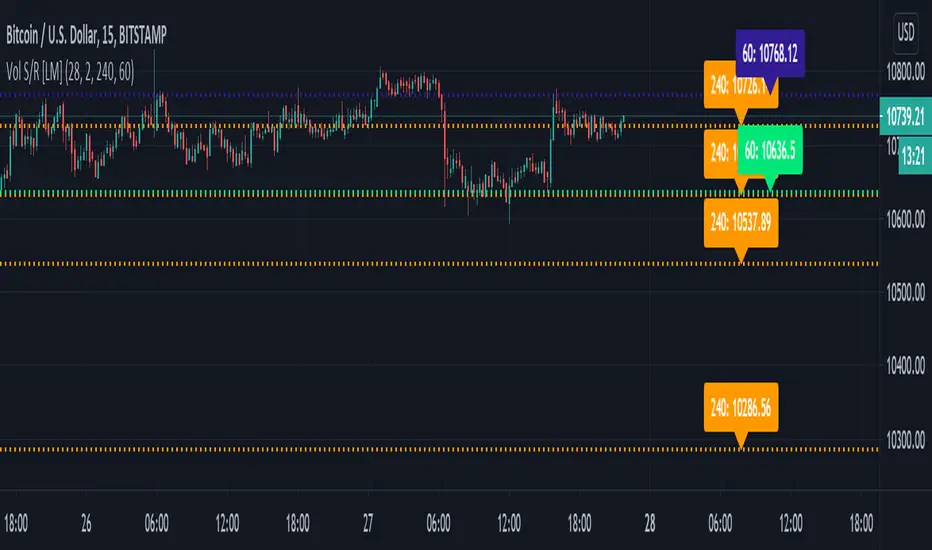
I would like to introduce you volume support and resistance horizontals. It draws line horizontal on high and low high volume candles that has volume above volume MA for certain period multiplied by multiplier and also the volume is increasing from previous volume . You can select lines on this timeframe and/or another one.
The colors are dynamic depending whether price is below or above the line:
for the current timeframe green is used for support and blue for resistance
for the other timeframe by default 4h orange is used for support and violet for resistance
There are various sections in setting:
volume - here you can select SMA volume length and multiplier
show and hide section of the current timeframe
other timeframe
show and hide other timeframe horizontals
I'm mainly looking smaller timeframe and trading higher timeframe from level to level
Any suggestions are welcome
Информация о релизе
fixing multi timeframe behaviorИнформация о релизе
adding another timeframe and labels for valuesИнформация о релизе
update to version 5Скрипт с открытым кодом
В истинном духе TradingView, создатель этого скрипта сделал его открытым исходным кодом, чтобы трейдеры могли проверить и убедиться в его функциональности. Браво автору! Вы можете использовать его бесплатно, но помните, что перепубликация кода подчиняется нашим Правилам поведения.
Отказ от ответственности
Информация и публикации не предназначены для предоставления и не являются финансовыми, инвестиционными, торговыми или другими видами советов или рекомендаций, предоставленных или одобренных TradingView. Подробнее читайте в Условиях использования.
Скрипт с открытым кодом
В истинном духе TradingView, создатель этого скрипта сделал его открытым исходным кодом, чтобы трейдеры могли проверить и убедиться в его функциональности. Браво автору! Вы можете использовать его бесплатно, но помните, что перепубликация кода подчиняется нашим Правилам поведения.
Отказ от ответственности
Информация и публикации не предназначены для предоставления и не являются финансовыми, инвестиционными, торговыми или другими видами советов или рекомендаций, предоставленных или одобренных TradingView. Подробнее читайте в Условиях использования.