OPEN-SOURCE SCRIPT
Обновлено RAT Momentum Squeeze BETA
V1.0
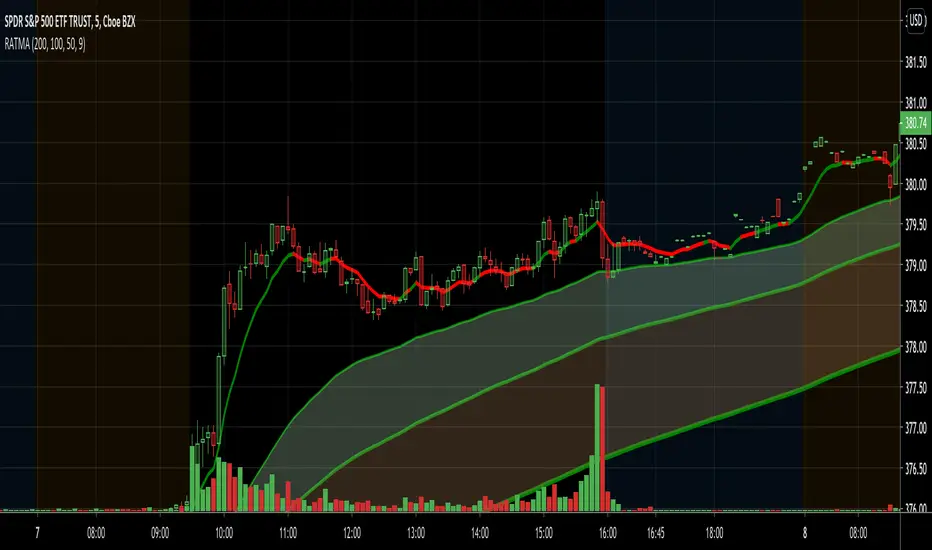
MAs are a great tool to measure the market's momentum. I created this indicator to graphically depict bullish and banishment movements with the moving averages.
Using the 50, 100, & 200 day MA in conjunction with the RSI we are able to find great swing setups. This is used best on the 30min & up to the daily chart.
Информация о релизе
*Cleaned up codeИнформация о релизе
V1.0 Release NotesAdded 9-day moving average with dynamic color based on 9-day RSI over/oversold levels
Added dynamic color changing to all moving averages based on the directional movement
Информация о релизе
Added conditional formatting to the colors on the 9-day moving average. The greener the color, the more overbought. The darker the red, the more oversold. I will tweak the colors of the cloud and line itself in a future update.Информация о релизе
Exciting new update :)-Added improved accuracy for the strength in the trend by calculating different RSI lengths
-Added bar overlays to help show the strength of the trend
-Improved colors on the 9 day MA overlay

Информация о релизе
Switched MAs to EMAs. After doing extensive backtesting I think EMAs are much more accurate for the purpose of this indicator Информация о релизе
Changed SMAs to EMAs for improved accuracy Информация о релизе
changed RSI sensitivity Скрипт с открытым кодом
В истинном духе TradingView, создатель этого скрипта сделал его открытым исходным кодом, чтобы трейдеры могли проверить и убедиться в его функциональности. Браво автору! Вы можете использовать его бесплатно, но помните, что перепубликация кода подчиняется нашим Правилам поведения.
Отказ от ответственности
Информация и публикации не предназначены для предоставления и не являются финансовыми, инвестиционными, торговыми или другими видами советов или рекомендаций, предоставленных или одобренных TradingView. Подробнее читайте в Условиях использования.
Скрипт с открытым кодом
В истинном духе TradingView, создатель этого скрипта сделал его открытым исходным кодом, чтобы трейдеры могли проверить и убедиться в его функциональности. Браво автору! Вы можете использовать его бесплатно, но помните, что перепубликация кода подчиняется нашим Правилам поведения.
Отказ от ответственности
Информация и публикации не предназначены для предоставления и не являются финансовыми, инвестиционными, торговыми или другими видами советов или рекомендаций, предоставленных или одобренных TradingView. Подробнее читайте в Условиях использования.