OPEN-SOURCE SCRIPT
Обновлено Dynamic 4-Hour Candle (Accurate Highs and Lows)
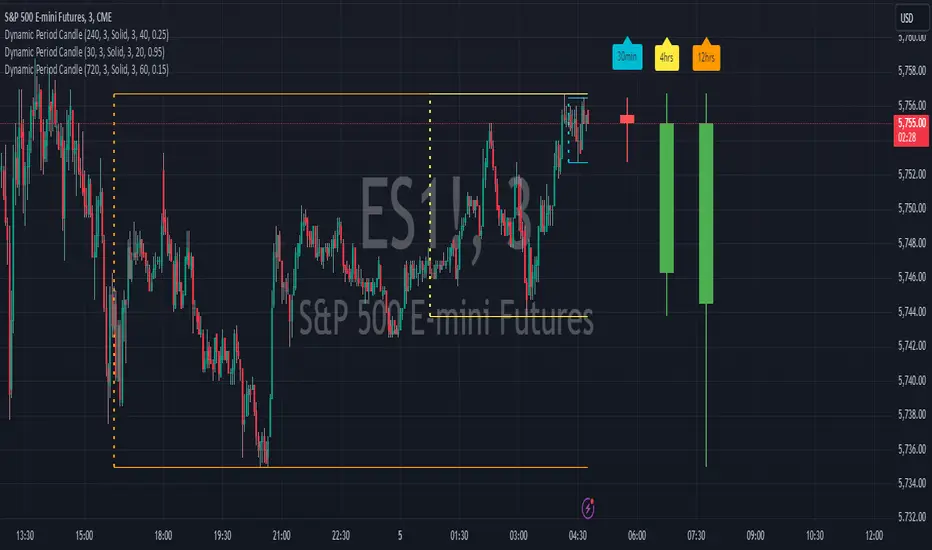
This gives a dynamic 4 hour history of the current price, so that you can assess the current trend. I found lots of indicators that looked at the previous 4 hr candle, but they then immediately switched to the new 4 hr candle when it started to be formed. this indicator looks back at the rolling previous 4 hours.
Информация о релизе
This is version 2 of this indicator. It allows you to change the look back period and the time frame of the chart that you are using it on. Информация о релизе
I also think that the candle is more accurate now in its representation of the previous time period specified, but please feel free to improve on this yourselves!Информация о релизе
added a setting to reposition the indicator on the chartИнформация о релизе
I've added a label that you can put above the candle, as it can be useful having a few of these on the chart covering different time frames, and the labels avoid any confusion as to what each candle represents.Информация о релизе
I've now added a line that you can add on the chart to show where each look back period is. This can be colour coded to match your labels, so you can clearly see which time period is being measured by witch line.Информация о релизе
Tidied teh label so that it now displays the hours instead of the minutes, if necessary.Информация о релизе
Added in optional high low lines on the chart for the time period, so you can easily see them if you prefer to have them up on the chart.Скрипт с открытым кодом
В истинном духе TradingView автор этого скрипта опубликовал его с открытым исходным кодом, чтобы трейдеры могли понять, как он работает, и проверить на практике. Вы можете воспользоваться им бесплатно, но повторное использование этого кода в публикации регулируется Правилами поведения.
Отказ от ответственности
Все виды контента, которые вы можете увидеть на TradingView, не являются финансовыми, инвестиционными, торговыми или любыми другими рекомендациями. Мы не предоставляем советы по покупке и продаже активов. Подробнее — в Условиях использования TradingView.
Скрипт с открытым кодом
В истинном духе TradingView автор этого скрипта опубликовал его с открытым исходным кодом, чтобы трейдеры могли понять, как он работает, и проверить на практике. Вы можете воспользоваться им бесплатно, но повторное использование этого кода в публикации регулируется Правилами поведения.
Отказ от ответственности
Все виды контента, которые вы можете увидеть на TradingView, не являются финансовыми, инвестиционными, торговыми или любыми другими рекомендациями. Мы не предоставляем советы по покупке и продаже активов. Подробнее — в Условиях использования TradingView.