OPEN-SOURCE SCRIPT
Обновлено Composite Index [TipsChain]

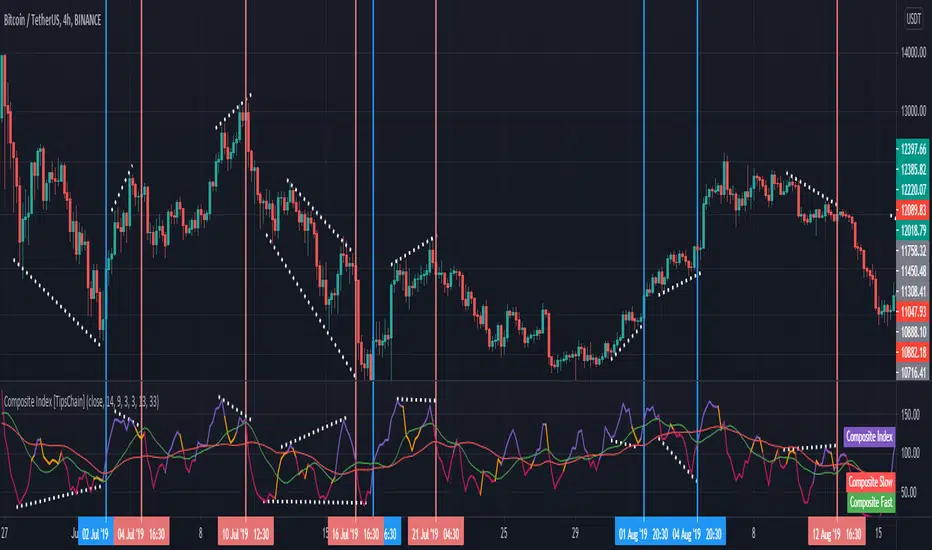
This is a formula Ms Brown developed to identify divergence failures with in the RSI . This also highlights the horizontal support levels with in the indicator area.
The Composite Index study comprises 2 momentum indicators on the RSI which are smoothed using a moving average. Control of the upper and lower indicators can be used to adjust the periods represented by each through the Object Properties dialog box for the study.
The Composite Index is an oscillator that will warn when the RSI is failing to detect a price trend reversal by forming divergences with the RSI. It can be used in any time frame or market.
Usage:
1. Check hidden and regular divergences on RSI+COMPOSITE_INDEX and PRICE+COMPOSITE_INDEX.
2. After finding divergence wait for COMPOSITE_INDEX to cross under/over it's moving averages to trigger.
Информация о релизе
Recreate the indicator according to Ms. Brown's book "Technical analysis for the trading professional"The formula of this indicator on page 369 of this book is as follows:
Step 1: create a 9-period momentum indicator of 14-period RSI. Yes, it is momentum on RSI , not price. This is an indicator on an indicator.
Step 2: create a very short3-period RSI and then a simple 3-period moving average of the 3-period RSI to smooth is Slightly.
Step 3: add Step 1 and 2 together to create the Composite Index.
Step 4: create two simple moving averages of the Composite Index using the period 13 and 33.
Step 5: plot the composite Index and its two simple averages as three lines in a separate frame under the price data.
Скрипт с открытым кодом
В истинном духе TradingView, создатель этого скрипта сделал его открытым исходным кодом, чтобы трейдеры могли проверить и убедиться в его функциональности. Браво автору! Вы можете использовать его бесплатно, но помните, что перепубликация кода подчиняется нашим Правилам поведения.
Отказ от ответственности
Информация и публикации не предназначены для предоставления и не являются финансовыми, инвестиционными, торговыми или другими видами советов или рекомендаций, предоставленных или одобренных TradingView. Подробнее читайте в Условиях использования.