OPEN-SOURCE SCRIPT
Обновлено Rolling CAGR
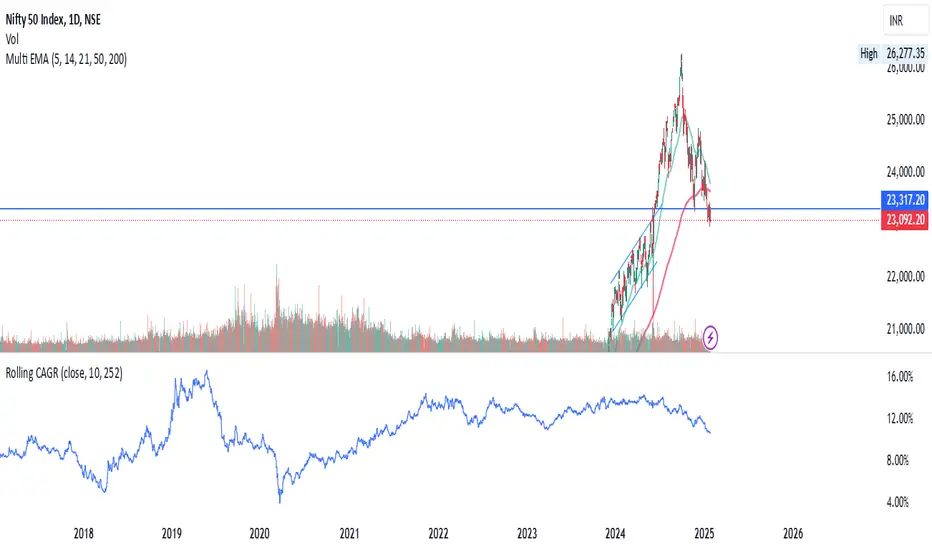
Rolling CAGR (Compound Annual Growth Rate) Indicator
This indicator calculates and plots the rolling Compound Annual Growth Rate (CAGR) for any selected data source. CAGR represents the mean annual growth rate of an investment over a specified time period, taking into account the effect of compounding.
Features:
• Customizable data source (default: close price)
• Adjustable time period in years
• Configurable trading days per year (252 for stocks, 365 for crypto)
• Results displayed as percentage values
• Works on daily timeframes
Input Parameters:
• Data Source: Select the price or indicator data to analyze
• Number of Years: Set the lookback period for CAGR calculation
• Trading Days in a Year: Adjust based on market type (252 for stocks, 365 for crypto)
Usage:
Perfect for analyzing long-term growth rates and comparing investment performance across different periods. The indicator provides a rolling view of compound growth, helping traders and investors understand the sustained growth rate of an asset over their chosen timeframe.
Note: This indicator is designed for daily timeframes as CAGR calculations are most meaningful over longer periods.
Formula Used:
CAGR = (End Value / Start Value)^(1/number of years) - 1
Информация о релизе
Rolling CAGR (Compound Annual Growth Rate) IndicatorThis indicator calculates and plots the rolling Compound Annual Growth Rate (CAGR) for any selected data source. CAGR represents the mean annual growth rate of an investment over a specified time period, taking into account the effect of compounding.
Features:
• Customizable data source (default: close price)
• Adjustable time period in years
• Configurable trading days per year (252 for stocks, 365 for crypto)
• Results displayed as percentage values
• Works on daily timeframes
Input Parameters:
• Data Source: Select the price or indicator data to analyze
• Number of Years: Set the lookback period for CAGR calculation
• Trading Days in a Year: Adjust based on market type (252 for stocks, 365 for crypto)
Usage:
Perfect for analyzing long-term growth rates and comparing investment performance across different periods. The indicator provides a rolling view of compound growth, helping traders and investors understand the sustained growth rate of an asset over their chosen timeframe.
Note: This indicator is designed for daily timeframes as CAGR calculations are most meaningful over longer periods.
Formula Used:
CAGR = (End Value / Start Value)^(1/number of years) - 1
Скрипт с открытым кодом
В истинном духе TradingView, создатель этого скрипта сделал его открытым исходным кодом, чтобы трейдеры могли проверить и убедиться в его функциональности. Браво автору! Вы можете использовать его бесплатно, но помните, что перепубликация кода подчиняется нашим Правилам поведения.
Отказ от ответственности
Информация и публикации не предназначены для предоставления и не являются финансовыми, инвестиционными, торговыми или другими видами советов или рекомендаций, предоставленных или одобренных TradingView. Подробнее читайте в Условиях использования.