OPEN-SOURCE SCRIPT
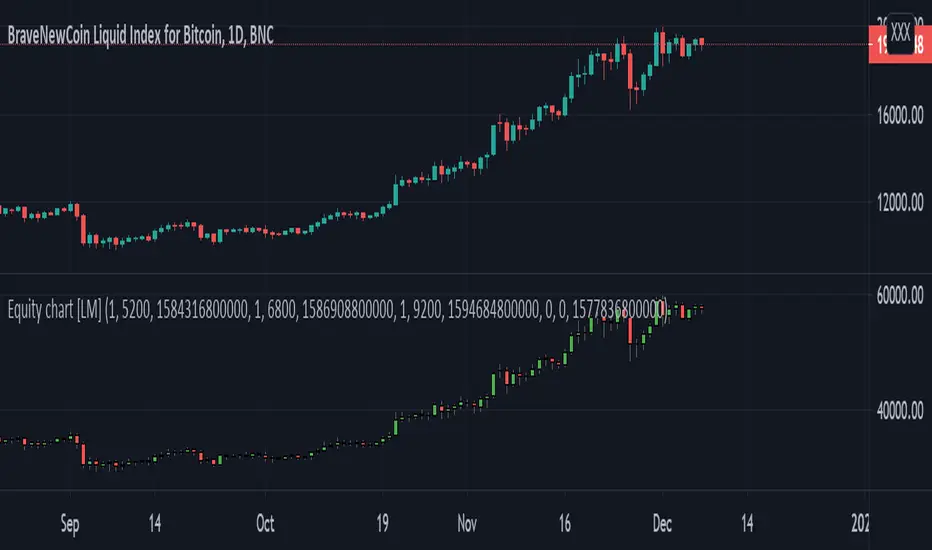
Equity chart [LM]

Hey Guys,
I have created draft version of chart where you can put your position amount and position price and position date for each entry and it will chart your equity as candle stick chart. There are currently possible to include 4 positions but you can add as many you like by modyfing the code.
It will calculate your average entry based on your input and in date where you add other entry it will create gap. I have already plan to include there also leverage on each position. The idea is that you should trade your equity and with this indicator you will be able to create your custom indicator based on equity chart and not price chart.
!! Unless you will enter position nothing will be rendered
Indicator is under breadth indicator because didn't know where to put it.
I release this script for collaboration and improving the idea with new features
Cheers,
Lukas
Скрипт с открытым кодом
В истинном духе TradingView, создатель этого скрипта сделал его открытым исходным кодом, чтобы трейдеры могли проверить и убедиться в его функциональности. Браво автору! Вы можете использовать его бесплатно, но помните, что перепубликация кода подчиняется нашим Правилам поведения.
Отказ от ответственности
Информация и публикации не предназначены для предоставления и не являются финансовыми, инвестиционными, торговыми или другими видами советов или рекомендаций, предоставленных или одобренных TradingView. Подробнее читайте в Условиях использования.